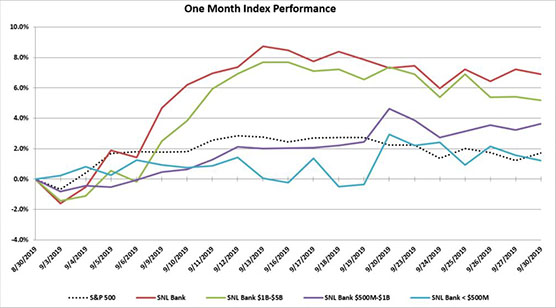
In the month of September the SNL Bank Index outperformed the S&P 500, with an increase of 6.9% compared to an increase of 1.7% for the S&P 500. The equity market has remained volatile due to developments relating to trade, monetary policy, and politics.
Both the U.S. and China added tariffs on one another’s goods, before later easing some of these tensions when President Trump said that the United States would delay the next round of tariff increases on Chinese imports. Attacks on the heart of Saudi Arabia’s oil infrastructure sent crude oil prices reeling and ramped up the specter of further conflict in the Middle East. Later in the month, House Democrats opened an impeachment inquiry of President Trump after revelations that Trump and top administration officials had allegedly pressured leaders of foreign nations in ways intended to advance Trump’s personal interests.
Recession fears have increased even though the economy has maintained a growth rate around 2% after hovering around 3% a year ago. The Federal Reserve decided to cut the federal funds rate for the second time this year by 25 basis points to a range of 1.75% – 2.00%. The Fed claims to have lowered interest rates because, although the U.S. Economy is strong and unemployment is low, business investments and exports have weakened. Markets widely expect the Fed to follow through with one more quarter-point cut in October, followed by a slow return to rising rates.
In economic news, data from the U.S. Department of Labor reported that nonfarm payrolls increased by just 136,000 in September, following an upwardly revised 168,000 rise in August and missing market expectations of 145,000. The unemployment rate dropped to a 50-year low at 3.5%, while average hourly earnings saw little change over the month and up just 2.9% for the year. Excluding government hiring, private payrolls grew by 135,000 in September, ahead of Dow Jones estimates for 125,000. In August, U.S. existing-home sales increased 1.3% from July. The median existing-home price for all housing types in August was $278,200, up 4.7% from August 2018 ($265,600). August’s price increase marks the 90th straight month of year-over-year gains.
Bank M&A pricing was down in September 2019 compared to September 2018 on a fewer number of transactions (see chart below).
The SNL Bank Index showed an overall increase through the month increasing 6.9%, outperforming the S&P 500 which was up 1.7% during the month. The SNL Bank Index was up in all size groups as banks between $1 billion and $5 billion increased 5.2%, banks between $500 million and $1 billion increased 3.6%, and banks below $500 million gained 1.2%.
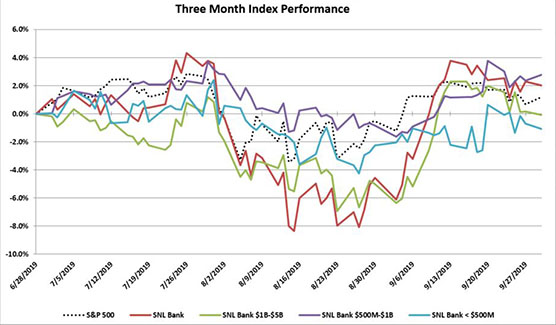
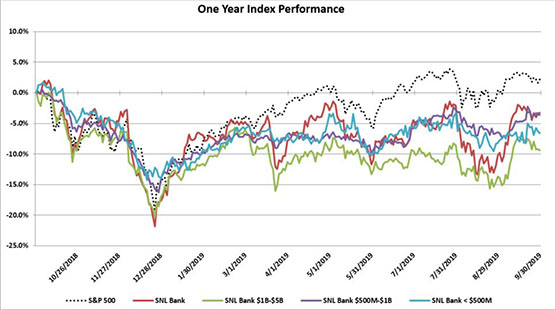
Over the three month period ending September 2019, the SNL Bank Index increased 2.0% while the S&P 500 gained 1.2%. Over the prior twelve months, the SNL Bank Index decreased 3.6% while the S&P 500 increased 2.2%. Banks between $500 million and $1 billion decreased 3.2%, while banks with assets less than $500 million decreased 6.6%, and banks between $1 billion and $5 billion decreased 9.4%.
REGIONAL PRICING HIGHLIGHTS
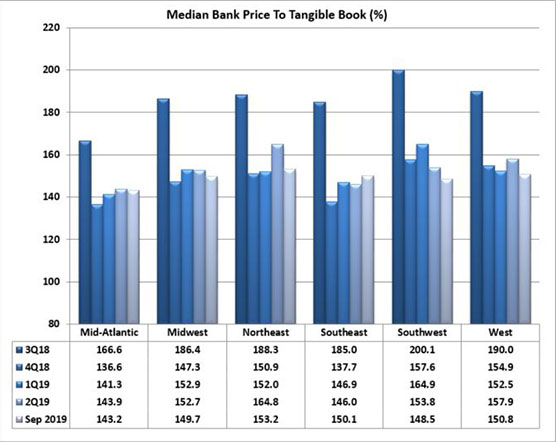
In September, pricing was up across the regions. The Southeast experienced the largest increase since August of 5.8%, rising to the third highest priced region on a price to tangible book multiple of 150.1%. The Northeast became the highest priced region at 153.2% price to tangible book after having increased 4.9% in the month. The Midwest and West increased 5.6% and 5.2%, respectively, to a price to tangible book of 149.7% and 150.8%, respectively. The Southwest saw the smallest increase, gaining 1.6% to a price to tangible book of 148.5%, while the Mid-Atlantic remained the lowest priced region on a price to tangible book multiple of 143.2%.
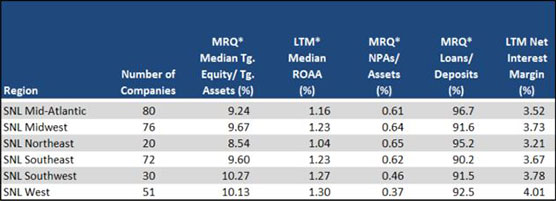
Pricing for public banks in the Southeast was supported by strong earnings (ROAA of 1.23%), net interest margin (NIM) (3.67%), and asset quality (NPAs/Assets of 0.62%). The Mid-Atlantic was the lowest priced region, and had the second weakest profitability (ROAA of 1.16%) and NIM (3.52%). The Northeast region’s asset quality has weakened (NPAs/Assets of 0.65%) and the region remained the second highest in loan demand (Loan/Deposits of 95.2%). The Midwest region remained the third strongest on profitability with an ROAA of 1.23% and the third highest NIM of 3.73%. The West remained the most profitable region with an ROAA of 1.30% and had the best NIM of 4.01%, the strongest asset quality (NPAs/Assets 0.37%), and stable loan demand with Loans/Deposits remaining 92.5%.
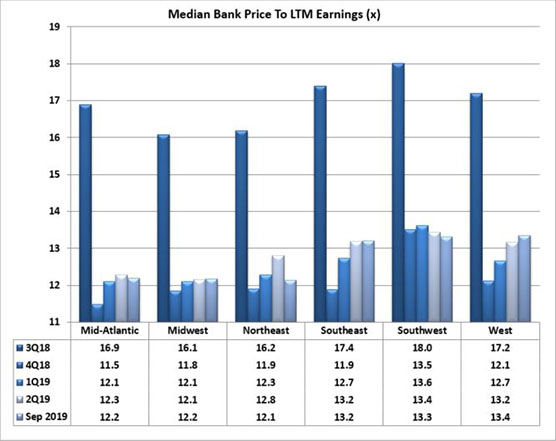
On a median price to earnings basis, pricing increased across all regions. The West region increased 5.0%, and is now the highest priced region with a price to earnings multiple of 13.4x. The Southwest region remained the second highest priced region with a price to earnings multiple of 13.3x after an increase of only 2.3% in September. The Southeast region saw a price increase of 4.4% in September to a price to earnings multiple of 13.2x, maintaining its position as the third highest priced of the regions. The Mid-Atlantic and Midwest increased by 5.4% and 4.7%, respectively, in September to a price to earnings multiple of 12.2x (tied for the second lowest in the group). The Northeast increased the most at 6.1% to a 12.1x price to earnings multiple (the lowest of any group).
PRICING BY SIZE
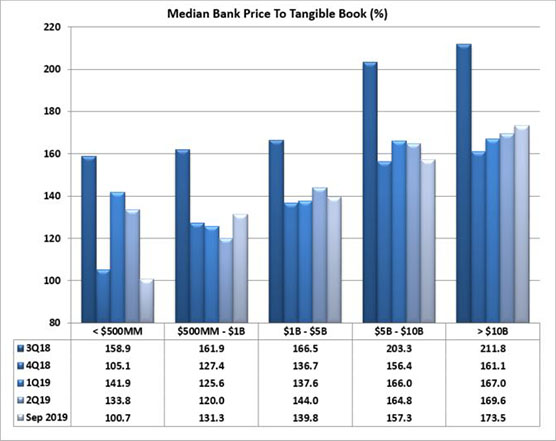
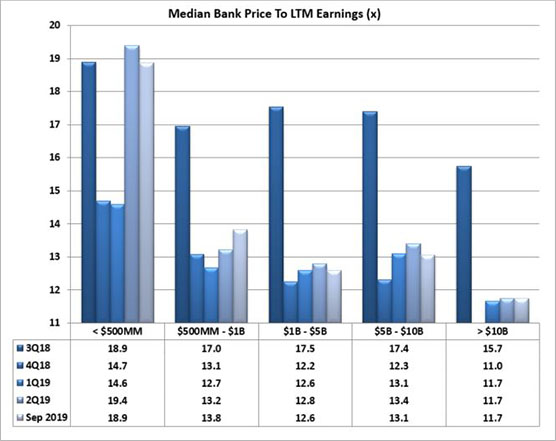
Size continues to impact bank stock prices. Financial institutions with total assets greater than $1 billion consistently report substantially higher median price to tangible book pricing than their peers with total assets less than $1 billion. In the month of September, that differential was 35.2% higher for the peers with assets greater than $1 billion on a price to tangible book basis. The second highest priced asset class remained the group with assets between $5 billion and $10 billion, which experienced an increase in pricing of 2.1% to a 157.3% price to tangible book multiple, below the 173.5% multiple of the banks greater than $10 billion which gained 7.6%. The group with assets from $1 billion to $5 billion saw an increase in pricing of 5.8% to a price to tangible book multiple of 139.8%. The group with assets from $500 million to $1 billion and the group with less than $500 million (which constitutes only five companies) ended the month with price to tangible book multiples of 131.3% and 100.7%, respectively, with pricing for the $500 million to $1 billion group increasing 4.2% while the group less than $500 million decreased 9.1% (the only group to lose ground in September). On a price to LTM earnings basis, the largest bank group (over $10 billion) saw an increase in pricing of 7.5%. The group with assets less than $500 million saw the smallest increase in its price to earnings multiple, up 0.5% to 18.9x but continues to remain highest priced group. The group with assets between $1 billion and $5 billion saw an increase of 4.5% to a price to earnings multiple of 12.6x (the second lowest among the groups), while the group between $5 billion and $10 billion saw the second largest increase in pricing, increasing 6.8% to a price earnings multiple of 13.1.
Financial institutions under $1 billion reported much lower LTM ROAA (average of medians 0.61%) and loan demand (average Loans/Deposits of 91.8%) than institutions with assets over $1 billion (average of median LTM ROAA of 1.21% and Loans/Deposits of 92.9%).

Mergers & Acquisitions by Region
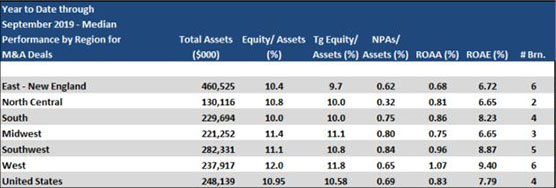
Bank consolidation was down through September 2019 as compared to September 2018 with 182 transactions announced through September 2019 (90 transactions with terms) compared to 189 transactions (97 with terms) through September 2018. Median YTD pricing through 2019 was lower than 2018 on a price to tangible book decrease of 9.2% (median 1.58x), a price to 8% tangible book decrease of 10.1% (1.71x), a decrease of price to deposits of 17.0% (18.4%), and a price to earnings basis with a 33.6% decrease on LTM earnings (16.7x).
The South region passed the Midwest in terms of the highest number of transactions with 43 deals through September of which 25 reported terms. Transactions in the Midwest reported the second lowest price to tangible book of the group with a multiple of 156%, the third highest price to 8% tangible book (175%), second to lowest (tied with the South),price to earnings (16.7x), and the second highest price to deposits at 19.4%. The West region has reported 14 deals in 2019 with 9 of them reporting terms, and reported the highest pricing on a price to tangible book basis, highest price to 8% tangible book, and highest price to deposits (168%, 195%, and 23.0%, respectively). The Southwest and North Central had 29 and 26 transactions, respectively, in 2019 (10 and 7 with terms, respectively), with a 163% and 165% price to tangible book, respectively. The East – New England region logged 28 transactions (22 with terms) with a price to tangible book of 159% and price to deposits of 17.8%.
