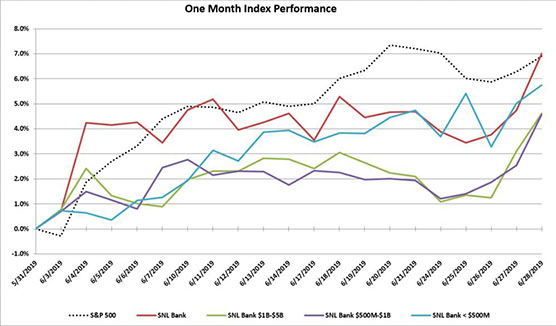
In the month of June the S&P 500 essentially matched performance the SNL Bank Index, with an increase of 6.9% compared to 7.0% for the SNL Bank Index. Bank stocks and the broader market traded higher as investors welcomed the prospects of easier monetary policy from the Federal Reserve and awaited clarity on trade relations between the U.S. and China.
Both indexes trended positive through the entirety of the month. Early in June, Fed Chairman Jerome Powell reiterated his commitment to sustaining economic growth in the U. S., which the market interpreted to mean rate cuts are on the horizon which sent stocks higher. Later in the month, President Trump increased pressure on the Fed before its interest rate decision, suggesting he would consider demoting Chairman Powell depending on the outcome of the policy meeting. At the Fed policy meeting, Powell made clear that the U.S. central bank is ready to cut interest rates, just not yet, holding the key rate in a range of 2.25% – 2.5%. Investors remain confident a rate cut is coming in July as expectations for a cut are at 100%.
In other related news, tensions between the U.S. and Iran flared up after Tehran shot down a U.S. military drone, which Iran said entered the country’s territory while the U.S. said happened over international airspace, leading to worries about a potential military conflict. Meanwhile, President Trump eased off his threat of tariffs on Mexico earlier in the month. However, the trade war with China is ongoing. Trump and China President Xi Jinping met at the G20 summit where the two leaders agreed to hold off on new tariffs and to proceed with trade negotiations.
In economic news, data from the U.S. Department of Labor reported that nonfarm payrolls increased by 224,000 in June, well ahead of the consensus estimates of 165,000. The unemployment slipped higher to 3.7% but remained near 50-year lows, while the average hourly earnings for employees increased 3.1% year over year. In May, U.S. existing-home sales rose 2.5% from April. Sales were 1.1% below the levels from a year ago, according to the National Association of Realtors. The median existing-home price for all housing types increased to $277,700, up 4.8% from the prior year.
Bank M&A pricing was slightly down in June 2019 compared to June 2018 on a fewer number of transactions (see chart below).
The SNL Bank Index showed an overall increase through the month gaining 7.0%, while the S&P 500 increased by 6.9% during the month. The SNL Bank Index was up in all size groups as banks between $1 billion and $5 billion increased 4.6%, banks between $500 million and $1 billion increased 4.6%, and banks below $500 million gained 5.8%.
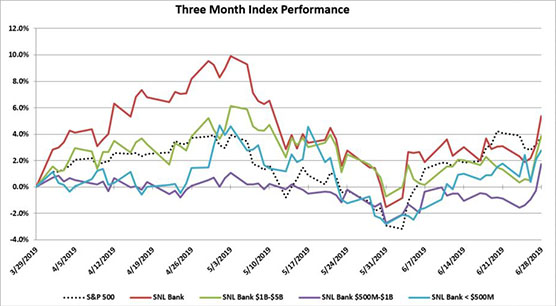
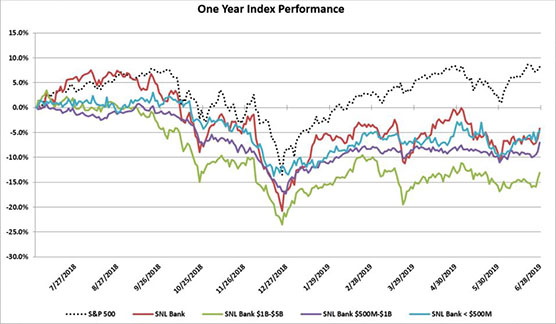
Over the three month period ending June 2019, the SNL Bank Index increased 5.4% while the S&P 500 gained 3.8%. Over the prior twelve months, the SNL Bank Index decreased 4.2% while the S&P 500 increased 8.2%. Banks between $500 million and $1 billion decreased 7.0%, while banks with assets less than $500 million decreased 4.6%, and banks between $1 billion and $5 billion decreased 13.1%.
REGIONAL PRICING HIGHLIGHTS
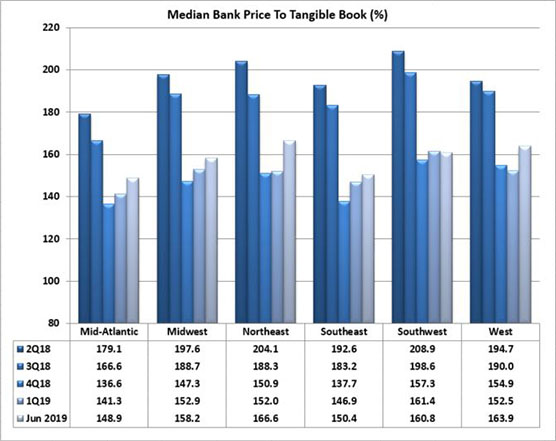
IIn June, pricing was up across all regions. The Midwest experienced the largest increase since May of 8.1%, yet remained the third lowest priced region on a price to tangible book multiple of 158.2%. The Northeast gained 6.4% to become the highest priced region at a 166.6% price to tangible book. The Southwest gained the least of any group at 0.5% to a price to tangible book of 160.8%, falling to the third highest priced region, while the Mid-Atlantic remained the lowest priced region on a price to tangible book multiple of 148.9%. The Southeast and West increased 2.8% and 7.5%, respectively, to a price to tangible book of 150.4% and 163.9%, respectively. The West positioned itself as the second highest priced region, and the Southwest region sits as the third lowest priced region.
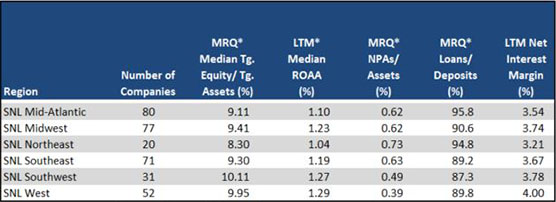
Pricing for public banks in the West was supported by strong earnings (ROAA of 1.29%), net interest margin (4.00%), and asset quality (NPAs/Assets of 0.39%). The Southeast was the second lowest priced region, and had the second weakest loan demand (Loan/Deposits of 89.2%), and middle of the road asset quality (NPAs/Assets of 0.63%), profitability (ROAA of 1.19%) and NIM (3.67%). The Northeast region’s asset quality remained the group’s worst (NPAs/Assets of 0.73%) and the region remained the second highest in loan demand (Loan/Deposits of 94.8%). The Midwest region remained at the third strongest profitability with an ROAA of 1.23% and a third highest Net Interest Margin of 3.74%. The West remained the most profitable region with an ROAA of 1.29% and had the best Net Interest Margin of 4.00%, the strongest asset quality (NPAs/Assets 0.39%), and improving loan demand with Loans/Deposits of 89.9%. The lowest priced region, the Mid-Atlantic, had the second lowest profitability with an ROAA of 1.10%, the third weakest asset quality (NPAs/Assets of 0.62%), but strong loan demand with Loans/Deposits of 95.8%.
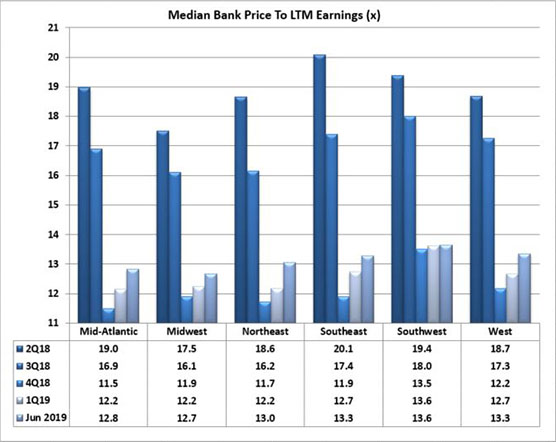
On a median price to earnings basis, pricing increased across each of the regions. The Northeast region increased 7.2%, and is now the fourth lowest priced region with a price to earnings multiple of 13.0x. The Southeast region remained the third highest priced region with a price to earnings multiple of 13.3x after an increase of 6.9% in June. The Southwest region saw a price increase of 2.0% in June to a price to earnings multiple of 13.6x, maintaining its position as the highest priced of the regions. The Mid-Atlantic increased by 7.4% in June with a price to earnings multiple of 12.8x (second lowest in the group). The West increased 50%, to a 13.3x price to earnings multiple, while the Midwest experienced an increase of 5.3% to a 12.7x price to earnings multiple, remaining the second lowest of the regions.
PRICING BY SIZE
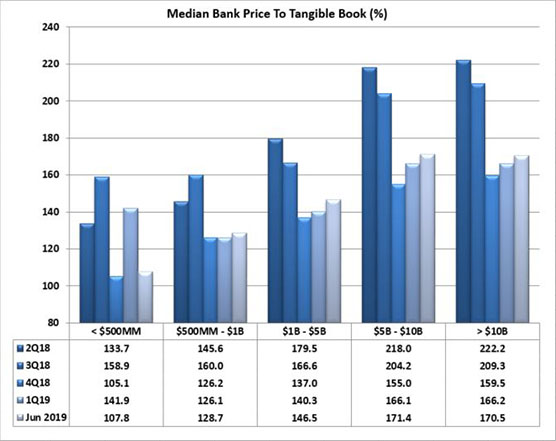
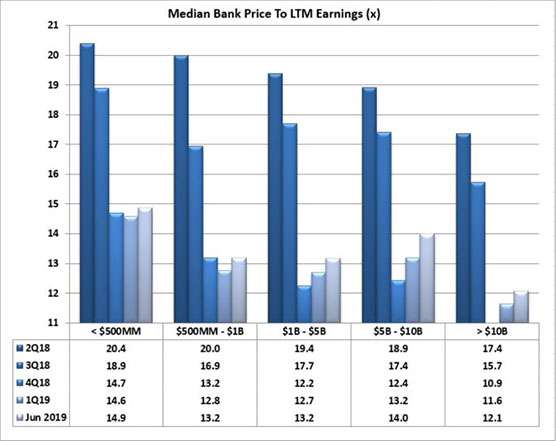
Size continues to impact bank stock prices. Financial institutions with total assets greater than $1 billion consistently report pricing approximately 50% higher median price to tangible book pricing than their peers with total assets less than $1 billion. In the month of May, that differential was 37.7% higher for the peers with assets greater than $1 billion on a price to tangible book basis. The highest priced asset class remained the group with assets between $5 billion and $10 billion, which experienced an decrease in pricing of 5.6% to a 171.4% price to tangible book multiple, ahead of the 170.5% multiple of the banks greater than $10 billion which gained 6.6%. The group with assets from $1 billion to $5 billion saw an increase in pricing of 5.6% to a price to tangible book multiple of 146.5%. The group with assets from $500 million to $1 billion and the group with less than $500 million (which constitutes only five companies) ended the month with price to tangible book multiples of 128.7% and 107.8%, respectively, with pricing for the $500 million to $1 billion group increasing 0.5% while the group less than $500 million decreased 21.7%. On a price to LTM earnings basis, the largest bank group (over $10 billion) saw an increase in pricing of 6.3%. The group with assets between $500 million and $1 billion saw the smallest increase in its price to earnings multiple, up 0.6% to 13.2x and is tied for the second lowest priced group. The group with assets between $1 billion and $5 billion saw an increase of 4.9% to a price to earnings multiple of 13.2x, while the group between $5 billion and $10 billion saw an increase in pricing of 7.1% to a price earnings multiple of 14.0x. The highest priced was the group with less than $500 million, increasing 11.1% to a 14.9x price to earnings multiple.
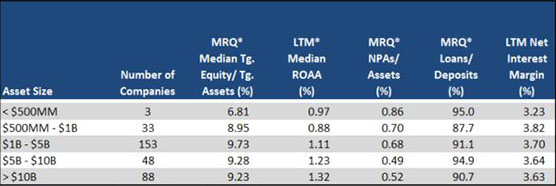
Financial institutions under $1 billion reported much lower LTM ROAA (average of medians 0.92%) and loan demand (average Loans/Deposits of 91.3%) than institutions with assets over $1 billion (average of median LTM ROAA of 1.22% and Loans/Deposits of 92.2%).
Mergers & Acquisitions by Region
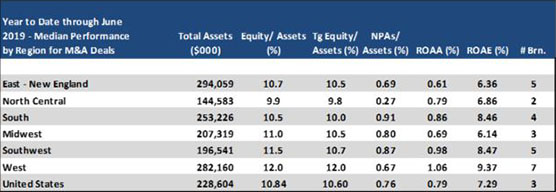
Bank consolidation was down through June 2019 as compared to June 2018 with 101 transactions announced through June 2019 (51 transactions with terms) compared to 131 transactions (73 with terms) through June 2018. Median pricing through 2019 was lower than 2018 on a price to tangible book decrease of 6.8% (median 1.63x), a price to 8% tangible book decrease of 7.3% (1.78x), a decrease of price to deposits of 11.1% (19.6%), and a price to earnings basis with a 31.5% decrease on LTM earnings (17.2x).
The South region continues to have the highest number of transactions and number of transactions with terms with 21 deals through June of which 13 reported terms. Transactions in the South reported the third lowest price to tangible book of the group with a multiple of 165%, the lowest price to 8% tangible book (163%), but second highest price to earnings (19.5x) and the second lowest price to deposits at 18.3%. The West region has reported 8 deals in 2019 with 5 of them reporting terms, and reported the highest pricing on a price to tangible book basis, highest price to 8% tangible book, and highest price to deposits (216%, 231%, and 30.6%, respectively). The Midwest and North Central had 24 and 14 transactions, respectively, in 2019 (11 and 4 with terms, respectively), with a 155% and 182% price to tangible book, respectively. The East – New England region logged 18 transactions (12 with terms) with a price to tangible book of 164% and price to deposits of 19.0%. The Southwest had 16 deals through June, and 6 with deal terms.

