Public Bank Stock Performance – October 2019
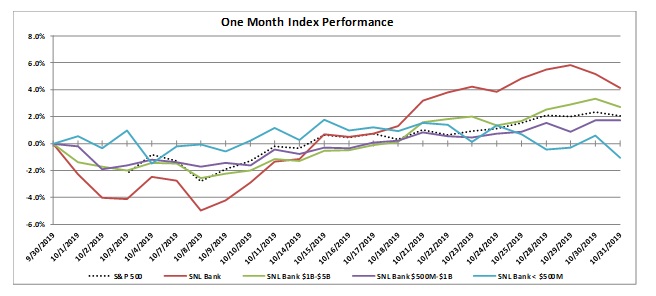
In the month of October, the SNL Bank Index outperformed the S&P 500, with an increase of 4.1% compared to an increase 2.0% for the S&P 500. The equity market remained volatile due to developments relating to trade, monetary policy, and politics.
The market saw an increase in prices in October as trade negotiations pushed on. President Trump announced that negotiations between the US and China had reached a “Phase 1” agreement that will take several weeks to finalize. As part of the agreement, China will have to purchase $40 – $50 billion in US agricultural products annually, strengthen intellectual property provisions, and issue new guidelines on how it manages its currency. President Trump also announced that the US would delay a tariff increase scheduled to go into effect on October 15. However, U.S. stocks slid at the end of October following reports that Chinese officials doubted whether a trade deal was soon to come. Chinese officials suggested that they would not be willing to make concessions on some of the major economic reforms the Trump administration has called for to reach an eventual long-term trade deal.
Recession fears have increased even though the economy has maintained a growth rate around 2% after hovering around 3% a year ago. The Federal Reserve decided to cut the federal funds rate for the third time this year by 25 basis points to a range of 1.50% – 1.75%. Along with the decrease came language pointing to a higher bar for future easing. The FOMC removed a key clause that had appeared in post-meeting statements since June saying it was committed to “act as appropriate to sustain the expansion”. The new language suggests an increased level of data dependence rather than an ongoing intent to adjust rates lower.
In economic news, data from the U.S. Department of Labor reported that nonfarm payrolls increased by just 128,000 in October, compared with forecasts for an increase of 85,000. The unemployment rate saw little change at 3.6%, while average hourly earnings increased by 3.0% for the year. Excluding government hiring, private payrolls grew by 125,000 in October, ahead of Dow Jones estimates for 100,000. In September, U.S. existing-home sales decreased 2.2% from August. The median existing-home price for all housing types in September was $272,100, up 5.9% from September 2018 ($256,900). September’s price increase marks the 91st straight month of year-over-year gains.
Bank M&A pricing was down in October 2019 compared to October 2018 on a fewer number of transactions (click here).
The SNL Bank Index showed an overall increase through the month gaining 4.1%, outperforming the S&P 500, which was up 2.0% during the month. The SNL Bank Index was up in the larger size groups as banks between $1 billion and $5 billion increased 2.7%, banks between $500 million and $1 billion increased 1.7%, and banks below $500 million lost 1.0%.
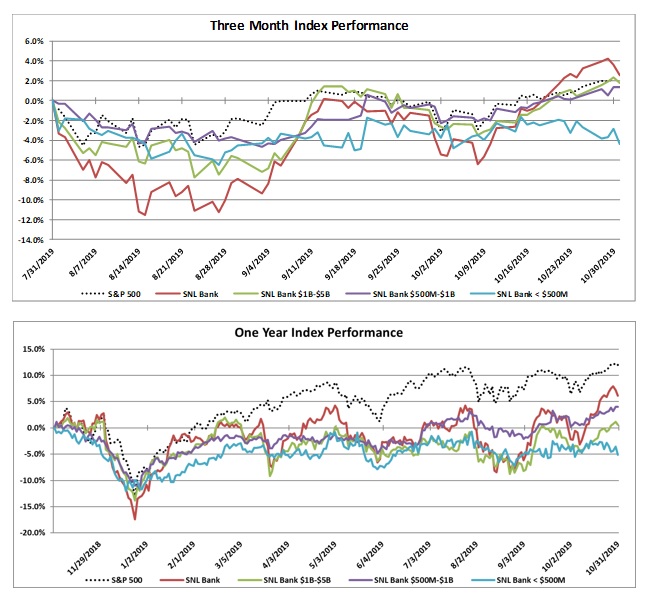
Over the three-month period ending October 2019, the SNL Bank Index increased 2.5% while the S&P 500 gained 1.9%. Over the prior twelve months, the SNL Bank Index increased 6.1% while the S&P 500 increased 12.0%. Banks between $1 billion and $5 billion increased 0.6%, banks between $500 million and $1 billion increased 4.0%, and banks with assets less than $500 million decreased 5.1%.
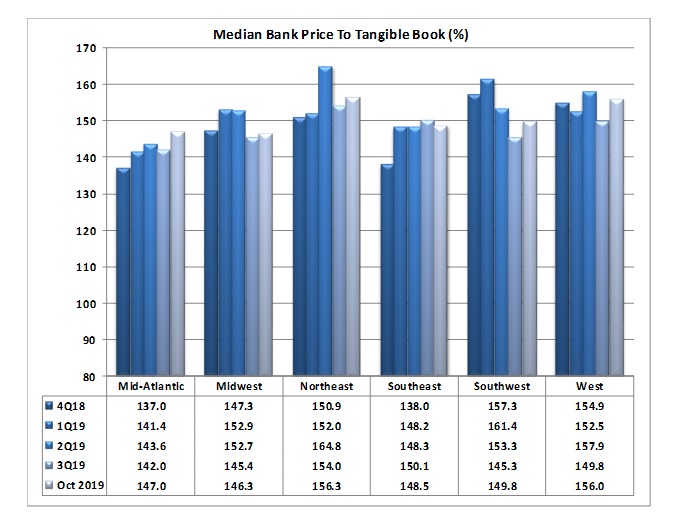
REGIONAL PRICING HIGHLIGHTS
In October, pricing was up across four of the six regions. Pricing was down in the Midwest and Southeast. The West experienced the largest increase since September of 3.5%, remaining the second highest priced region on a price to tangible book multiple of 156.0%. The Northeast continued to be the highest priced region at 156.3% price to tangible book after gaining 2.0% in the month. The Mid-Atlantic and Southwest increased 2.6% and 0.8%, respectively, to a price to tangible book of 147.0% and 149.8%, respectively. The Midwest saw the largest decrease, decreasing 2.2% to a price to tangible book of 146.3%. The Southeast also saw a decrease of 1.0% with a price to tangible book multiple of 148.5%.
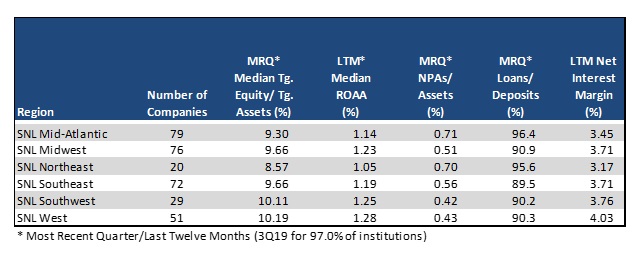
The West remained the most profitable region with an ROAA of 1.28% and had the best NIM of 4.03%, the second strongest asset quality (NPAs/Assets 0.43%), and stable loan demand with Loans/Deposits remaining 90.3%. The Midwest was the lowest priced region, and had the same profitability as reported in September (ROAA of 1.23%) with a weaker NIM (3.71%). The Northeast region’s asset quality has weakened (NPAs/Assets of 0.70%) and the region remained the second highest in loan demand (Loan/Deposits of 95.6%). The Southwest region remained the second strongest on profitability with an ROAA of 1.25% and the second highest NIM of 3.76%.
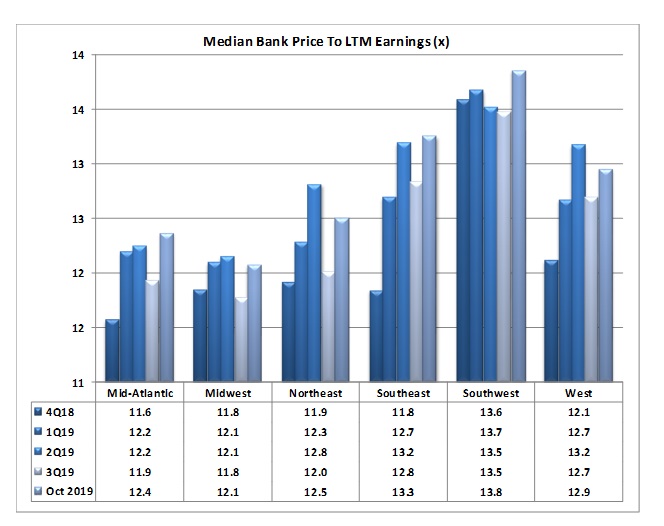
On a median price to earnings basis, pricing increased across four of the six regions. Pricing was down in the Midwest and West Regions. The West region decreased 3.0%, and is now the third highest priced region with a price to earnings multiple of 12.9x. The Southwest region rose to the highest priced region with a price to earnings multiple of 13.8x after an increase of 4.0% in October. The Southeast region saw a price increase of 0.3% in October to a price to earnings multiple of 13.3x, rising to the second highest priced of the regions. The Mid-Atlantic and Northeast increased by 1.4% and 3.0%, respectively, in October to a price to earnings multiple of 12.4x and 12.5x (the second and third lowest regions respectively). The Midwest decreased by 0.9%% to a 12.1x price to earnings multiple (the lowest of any group).
PRICING BY SIZE
Size continues to impact bank stock prices. Financial institutions with total assets greater than $1 billion consistently report substantially higher median price to tangible book pricing than their peers with total assets less than $1 billion. In the month of October, that differential was 34.7% higher for the peers with assets greater than $1 billion on a price to tangible book basis. The second highest priced asset class remained the group with assets between $5 billion and $10 billion, which experienced an increase in pricing of 2.2% to a 160.8% price to tangible book multiple, below the 168.6% multiple of the banks greater than $10 billion which decreased by 2.8%. The group with assets from $1 billion to $5 billion remained stable at a price to tangible book multiple of 139.8%. The group with assets from $500 million to $1 billion and the group with less than $500 million (which constitutes only three companies) ended the month with price to tangible book multiples of 128.7% and 110.1%, respectively, with pricing for the $500 million to $1 billion group decreasing 2.0% while the group less than $500 million increased by 9.3%. On a price to LTM earnings basis, the largest bank group (over $10 billion) saw an increase in pricing of 3.1%. The group with assets between $500 million and $1 billion saw the largest decrease in its price to earnings multiple, down 6.4% to 12.9x. The group with assets between $1 billion and $5 billion saw slight decrease of 0.2% to a price to earnings multiple of 12.6x (the second lowest among the groups), while the group between $5 billion and $10 billion saw the largest increase in pricing, increasing 3.2% to a price earnings multiple of 13.5x. The asset group with less than $500 million assets remained the highest priced with a price to earnings multiple of 18.7x.
Financial institutions under $1 billion reported much lower LTM ROAA (average of medians 0.63%) and loan demand (average Loans/Deposits of 87.5%) than institutions with assets over $1 billion (average of median LTM ROAA of 1.21% and Loans/Deposits of 92.7%).
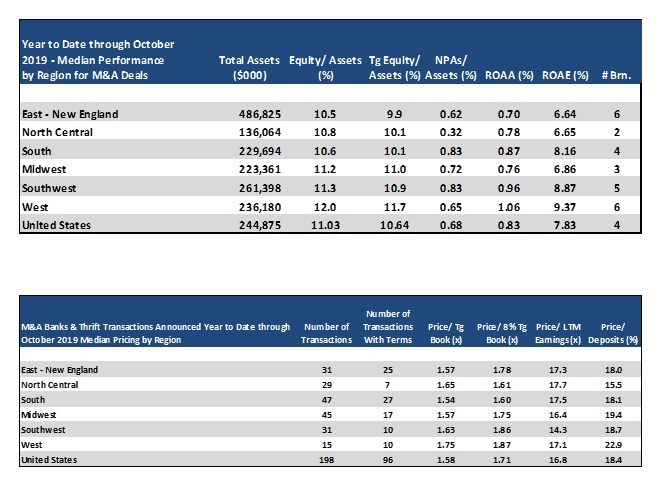
Mergers & Acquisitions by Region
Bank consolidation was down through October 2019 as compared to October 2018 with 198 transactions announced through October 2019 (96 transactions with terms) compared to 203 transactions (106 with terms) through October 2018. Median YTD pricing through 2019 was lower than 2018 on a price to tangible book decrease of 9.5% (median 1.58x), a price to 8% tangible book decrease of 9.9% (1.71x), a decrease of price to deposits of 15.8% (18.4%), and a price to earnings basis with a 32.8% decrease on LTM earnings (16.8x).
The South region passed the Midwest in terms of the highest number of transactions with 47 deals through October of which 27 reported terms. Transactions in the Midwest reported the second lowest price to tangible book of the group with a multiple of 157%, the third lowest price to 8% tangible book (175%), second to lowest price to earnings multiple (16.4x), and the second highest price to deposits at 19.4%. The West region has reported 15 deals in 2019 with 10 of them reporting terms, and reported the highest pricing on a price to tangible book basis, highest price to 8% tangible book, and highest price to deposits (175%, 187%, and 22.9%, respectively). The Southwest and North Central had 31 and 29 transactions, respectively, in 2019 (10 and 7 with terms, respectively), with a 163% and 165% price to tangible book, respectively. The East – New England region logged 31 transactions (25 with terms) with a price to tangible book of 157% and price to deposits of 18.0%.
October 2019 Monthly M&A Update