
Chris Noon, Director- Valuations
Public Bank Stock Performance – November 2019
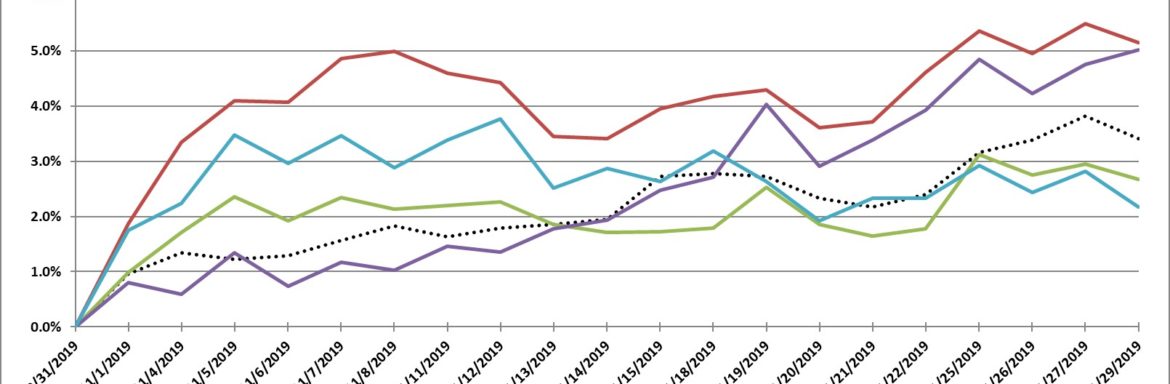
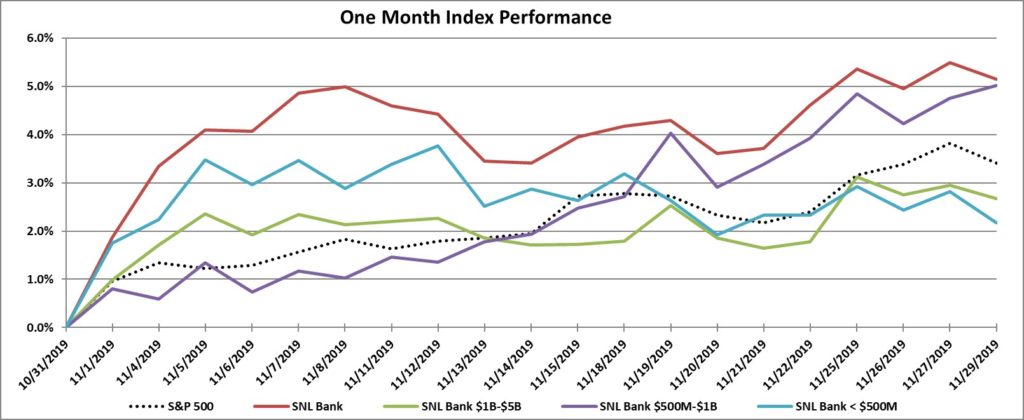
In the month of November, the SNL Bank Index outperformed the S&P 500, with an increase of 5.1% compared to an increase 3.4% for the S&P 500. Stocks saw solid gains at the start of the month which continued through Thanksgiving, thanks to solid economic data, improving trade sentiment, and upside earnings surprises.
October’s momentum continued into the new month as stocks saw record highs on the first day of November, after the employment report was released and the data was better than expected. However, President Trump signed two bills into law toward the end of November supporting the Hong Kong protestors. One of the bills calls for an annual review of Hong Kong’s autonomy from China and the other bans the sale of munitions to Hong Kong police. The president’s move angered China and the nation’s foreign ministry spokesperson, Geng Shuang stated, “This act neglects facts and truth, applies double standards and blatantly interferes in Hong Kong affairs and China’s other internal affairs. It is in serious violation of international law and basic norms governing international relations. China condemns and firmly opposes it.” Shuang ended the statement by saying that the U.S. should stop its wrongdoing before it is too late. The U.S. and China are in a prolonged trade war, and many have become concerned that the president’s move to support the Hong Kong protestors could hinder ongoing trade negotiations.
Recession fears have increased even though the economy has maintained a growth rate around 2% after hovering around 3% a year ago. The Federal Reserve decided to cut the federal funds rate for the third time this year by 25 basis points to a range of 1.50% – 1.75%. Along with the decrease came language pointing to a higher bar for future easing.
In economic news, data from the U.S. Department of Labor reported that nonfarm payrolls increased by 266,000 in November, compared with forecasts for an increase of 187,000. The unemployment rate saw little change at 3.5%, while average hourly earnings increased by 3.1% for the year. Excluding government hiring, private payrolls grew by 67,000 in November, below Dow Jones estimates for 150,000. In October, U.S. existing-home sales increased 1.9% from September. The median existing-home price for all housing types in October was $270,900, up 6.2% from October 2018 ($255,100). September’s price increase marks the 92st straight month of year-over-year gains.
Bank M&A pricing was down in November 2019 compared to November 2018 on a fewer number of transactions. Click here
The SNL Bank Index showed an overall increase through the month gaining 5.1%, outperforming the S&P 500, which was up 3.4% during the month. The SNL Bank Index was up in the larger size groups as banks between $1 billion and $5 billion increased 2.7%, banks between $500 million and $1 billion increased 5.0%, and banks below $500 increased 2.2%.
Over the three-month period ending November 2019, the SNL Bank Index increased 17.0% while the S&P 500 gained 7.3%. Over the prior twelve months, the SNL Bank Index increased 8.8% while the S&P 500 increased 13.8%. Banks between $1 billion and $5 billion increased 2.1%, banks between $500 million and $1 billion increased 12.1%, and banks with assets less than $500 million increased 2.0%.

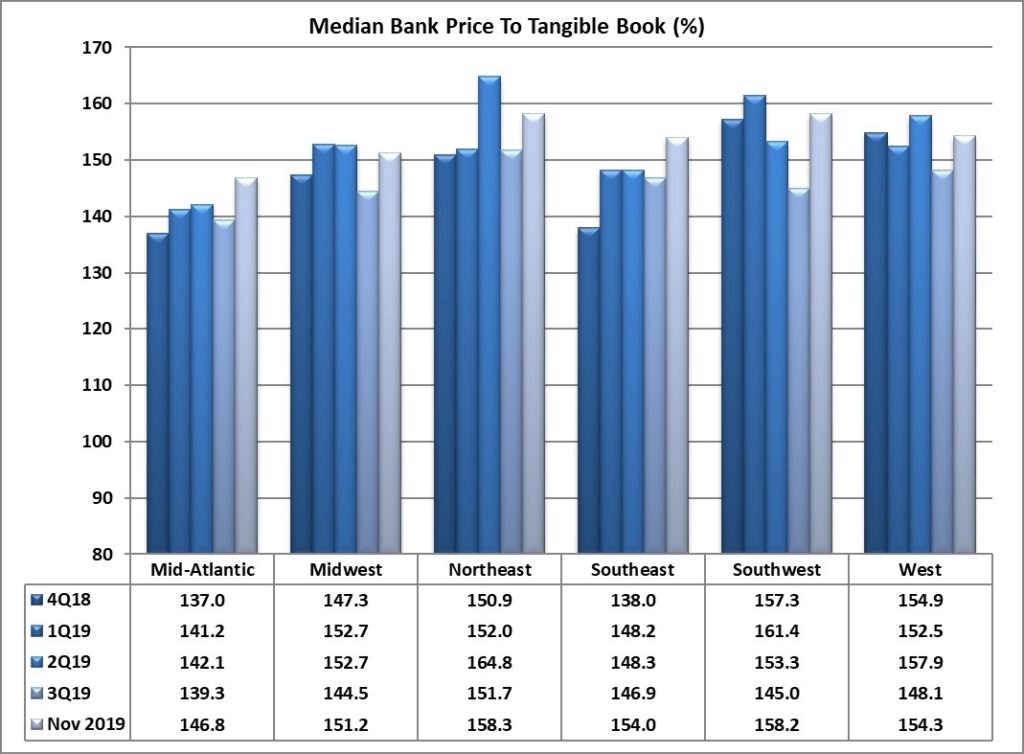
Regional Pricing Highlights
In November, pricing was up across four of the six regions. Pricing was down in the Mid-Atlantic and West. The Southwest experienced the largest increase since November of 5.6%, becoming the second highest priced region on a price to tangible book multiple of 158.2%. The Northeast continued to be the highest priced region at 158.3% price to tangible book after gaining 1.3% in the month. The Midwest and Southeast increased 3.4% and 3.7%, respectively, to a price to tangible book of 151.2% and 154.0%, respectively. The West saw the largest decrease, decreasing 1.1% to a price to tangible book of 154.3%. The Mid-Atlantic also saw a decrease of 0.1% with a price to tangible book multiple of 146.8%.
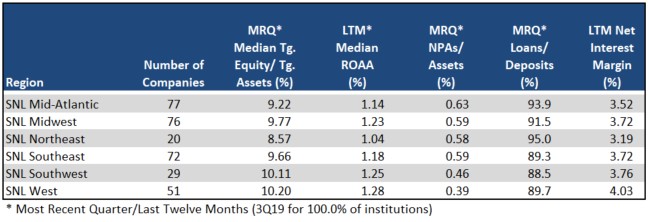
The West remained the most profitable region with an ROAA of 1.28% and had the best NIM of 4.03%, the strongest asset quality (NPAs/Assets 0.39%), and stable loan demand with Loans/Deposits of 89.7%. The Mid-Atlantic was the lowest priced region, and lower profitability as reported in October (ROAA of 1.14%) with a weaker NIM (3.52%). The Northeast region’s asset quality has strengthened (NPAs/Assets of 0.58%) and the region became the highest in loan demand (Loan/Deposits of 95.0%). The Southwest region remained the second strongest on profitability with an ROAA of 1.25% and the second highest NIM of 3.76%.
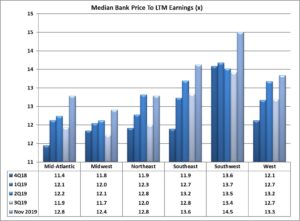
On a median price to earnings basis, pricing increased across all six regions. The West region increased 3.0%, and remained the third highest priced region with a price to earnings multiple of 13.3x. The Southwest region remained the highest priced region with a price to earnings multiple of 14.5 after an increase of 4.7% in November. The Southeast region saw a price increase of 2.8% in November to a price to earnings multiple of 13.3x, remaining the second highest priced of the regions. The Mid-Atlantic and Northeast increased by 3.4% and 2.3%, respectively, in November to a price to earnings multiple of 12.8x (tied for the second a lowest of the regions). The Midwest increased by 2.7% to a 12.4x price to earnings multiple (the lowest of any group).
Pricing by Size
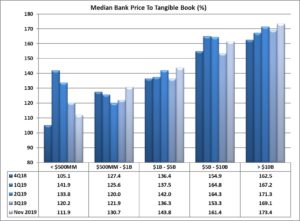
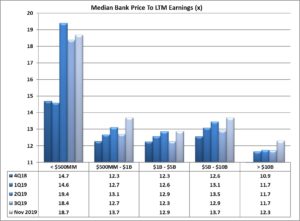
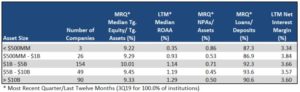
Size continues to impact bank stock prices. Financial institutions with total assets greater than $1 billion consistently report substantially higher median price to tangible book pricing than their peers with total assets less than $1 billion. In the month of November, that differential was 33.1% higher for the peers with assets greater than $1 billion on a price to tangible book basis. The second highest priced asset class remained the group with assets between $5 billion and $10 billion, which experienced an increase in pricing of 0.4% to a 161.4% price to tangible book multiple, below the 173.4% multiple of the banks greater than $10 billion which increased by 2.8%. The group with assets from $1 billion to $5 billion increased by 2.8% to a price to tangible book multiple of 143.8%. The group with assets from $500 million to $1 billion and the group with less than $500 million (which constitutes only three companies) ended the month with price to tangible book multiples of 130.7% and 111.9%, respectively, with pricing for the $500 million to $1 billion group increasing 1.5% while the group less than $500 million increased by 1.7%. On a price to LTM earnings basis, the largest bank group (over $10 billion) saw an increase in pricing of 1.6%. The group with assets between $500 million and $1 billion saw the largest increase in its price to earnings multiple, up 5.8% to 13.7x. The group with assets between $1 billion and $5 billion saw an increase of 2.6% to a price to earnings multiple of 12.9x (the second lowest among the groups), while the group between $5 billion and $10 billion saw an increase in pricing by 1.6% to a price earnings multiple of 13.7x. The asset group with less than $500 million assets remained the highest priced with a price to earnings multiple of 18.7x.
Financial institutions under $1 billion reported much lower LTM ROAA (average of medians 0.64%) and loan demand (average Loans/Deposits of 87.1%) than institutions with assets over $1 billion (average of median LTM ROAA of 1.19% and Loans/Deposits of 92.3%).
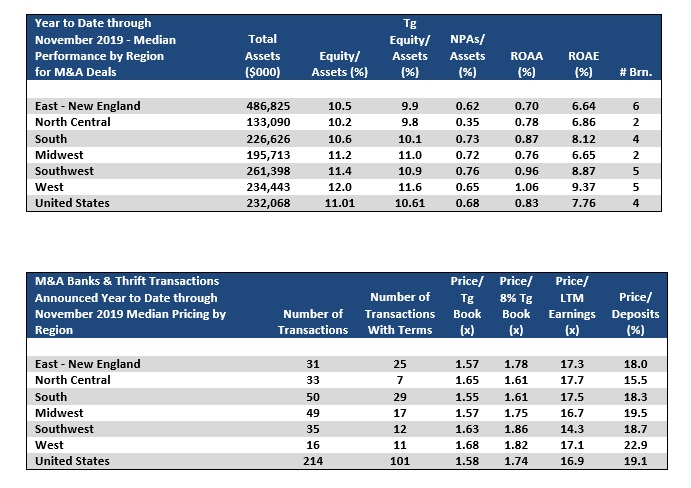
Mergers & Acquisitions by Region
Bank consolidation was down slightly through November 2019 as compared to November 2018 with 214 transactions announced through November 2019 (101 transactions with terms) compared to 222 transactions (116 with terms) through November 2018. Median YTD pricing through 2019 was lower than 2018 on a price to tangible book decrease of 10.2% (median 1.58x), a price to 8% tangible book decrease of 8.2% (1.74x), a decrease of price to deposits of 9.8% (19.1%), and a price to earnings basis with a 31.0% decrease on LTM earnings (16.9x).
The South region passed the Midwest in terms of the highest number of transactions with 50 deals through November of which 29 reported terms. Transactions in the South reported the lowest price to tangible book of the group with a multiple of 155%. Transactions in the Midwest reported the second lowest price to tangible book of the group with a multiple of 157%, the third lowest price to 8% tangible book (175%), second to lowest price to earnings multiple (16.7x), and the second highest price to deposits at 19.5%. The West region has reported 16 deals in 2019 with 11 of them reporting terms, and reported the highest pricing on a price to tangible book basis, second highest price to 8% tangible book, and highest price to deposits (168%, 182%, and 22.9%, respectively). The Southwest and North Central had 35 and 33 transactions, respectively, in 2019 (12 and 7 with terms, respectively), with a 163% and 165% price to tangible book, respectively. The East – New England region logged 31 transactions (25 with terms) with a price to tangible book of 157% and price to deposits of 18.0%.
Click here to view all the transactions announced in November 2019