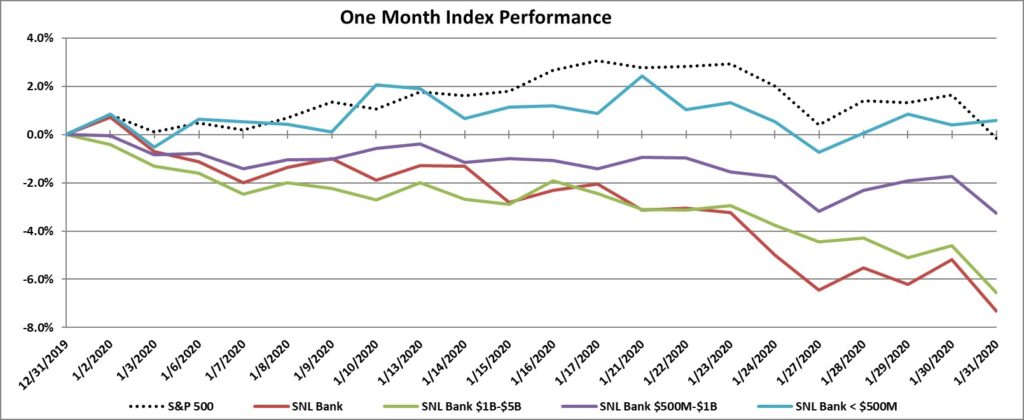
In the month of January, the S&P 500 outperformed the SNL Bank Index, with a decrease of 0.2% compared to a decrease of 7.3% for the SNL Bank Index. Stocks saw solid gains during the middle of January before taking a turn as fears surrounding the coronavirus overtook investor sentiment.
Stock prices accelerated as trade sentiment improved and seemed headed for a positive opening few weeks, only to see that progress halted by growing fares about the spreading coronavirus. The last trading day in January opened on the downside, and the major indexes accelerated their slide to the end of the month. Negative sentiment was largely driven by fears over the rapidly spreading Wuhan coronavirus. Investors are clearly worried about the potential economic impact of the virus, particularly as to how it will affect China, which has grown to be a global production powerhouse and voracious consumer of goods.
Recession fears have increased despite the economy maintaining a growth rate around 2% after hovering around 3% a year ago. The Federal Reserve left the target range for its federal funds rate unchanged at 1.50% to 1.75% on January 29, 2020 as expected. The Federal Reserve expressed that the current stance of monetary policy is appropriate to support sustained expansion of economic activity, strong labor market conditions, and inflation returning to the 2% objective. The first monetary policy decision in 2020 suggests that no changes in the funds rate should be expected during this year.
In economic news, data from the U.S. Department of Labor reported that nonfarm payrolls increased by 225,000 in January, compared with forecasts for an increase of 158,000. The unemployment rate increased to 3.6%, while average hourly earnings increased by 3.1% year over year. Excluding government hiring, private payrolls grew by 291,000 in January, exceeding Dow Jones estimates for 157,000. In December, U.S. existing-home sales increased 3.6% from November. The median existing-home price for all housing types in December was $274,500, up 7.8% from December 2018 ($253,100). December’s price increase marks the 94th straight month of year-over-year gains.
Bank M&A pricing was down in January 2020 compared to January 2019 on a fewer number of transactions, click here.
The SNL Bank Index showed an overall decrease through the month decreasing 7.3%, compared to the S&P 500, which was down only 0.2% during the month. The SNL Bank Index was down in the larger size groups as banks between $1 billion and $5 billion decreased 6.6%, banks between $500 million and $1 billion decreased 3.3%, and banks below $500 increased 0.6%.
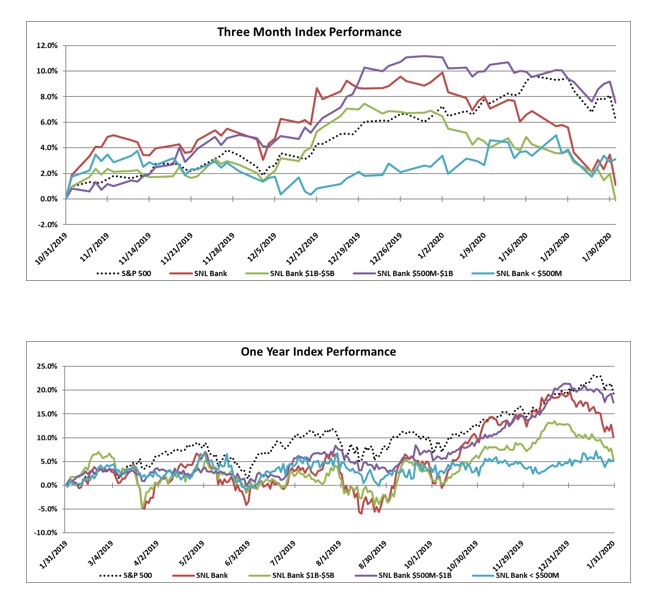
Over the three-month period ending January 2020, the SNL Bank Index increased 1.1% while the S&P 500 gained 6.2%. Over the prior twelve months, the SNL Bank Index increased 10.2% while the S&P 500 increased 19.3%. Banks between $1 billion and $5 billion increased 5.5%, banks between $500 million and $1 billion increased 17.4%, and banks with assets less than $500 million increased 5.2%.
Regional Pricing Highlights
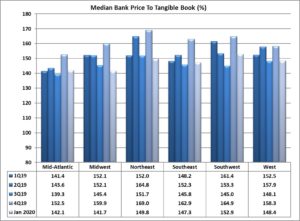
In January, pricing was down across all six regions. The Midwest experienced the largest decrease since December of 11.7%, falling to the lowest priced region with a price to tangible book multiple of 141.7%. The Southwest remained the highest priced region at 152.9% price to tangible book after decreasing by 9.0% in the month. The West and Southeast decreased 8.6% and 8.7%, respectively, to a price to tangible book of 148.4% and 147.3%, respectively. The Northeast saw an 8.0% decrease to a price to tangible book of 149.8%, while the Mid-Atlantic was the second lowest priced region on a price to tangible book multiple of 142.1%.
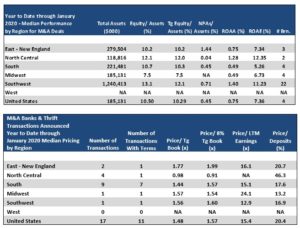
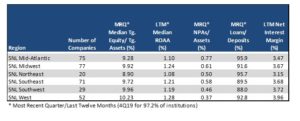
The West remained the most profitable region with an ROAA of 1.28% and had the best NIM of 3.96%, the strongest asset quality (NPAs/Assets 0.37%), and stable loan demand with Loans/Deposits of 92.8%. The Midwest was the lowest priced region, but was the second highest in profitability (ROAA of 1.24%) and had NIM of 3.67%. The Northeast region’s asset quality has improved since December (NPAs/Assets of 0.50% from 0.58%) and the region remained the highest in loan demand (Loan/Deposits of 95.7%). The Southwest region had the second strongest NIM of 3.72% and the fourth strongest profitability with an ROAA of 1.19x.
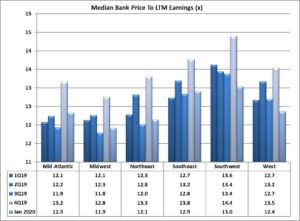
On a median price to earnings basis, pricing decreased across all of the six regions. The Southwest region decreased 8.8%, but remains the highest priced region with a price to earnings multiple of 13.0x. The Southeast and West decreased 6.9% and 8.9%, respectively, to a price to earnings multiple of 12.9x and 12.4x, representing the second and third highest priced regions, respectively. The Mid-Atlantic saw a decrease of 8.0% in January to a price to earnings multiple of 12.3x. The Midwest and Northeast decreased by 8.2% and 6.8%, respectively, in January to a price to earnings multiple of 11.9x and 12.1x, respectively (representing the lowest and second lowest priced region).
Pricing by Size
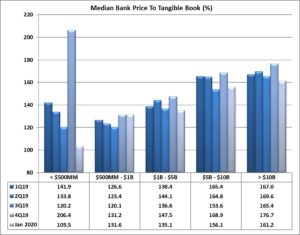
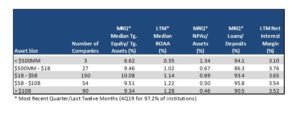
Size continues to impact bank stock prices. Financial institutions with total assets greater than $1 billion consistently report substantially higher median price to tangible book pricing than their peers with total assets less than $1 billion. In the month of January, that differential was 32.8% higher for the peers with assets greater than $1 billion on a price to tangible book basis. The second highest priced asset class remained the group with assets between $5 billion and $10 billion, which experienced a decrease in pricing of 9.3% to a 156.1% price to tangible book multiple, below the 161.2% multiple of the banks greater than $10 billion which decreased by 8.6%. The group with assets from $1 billion to $5 billion decreased by 9.1% to a price to tangible book multiple of 135.1%. The group with assets from $500 million to $1 billion and the group with less than $500 million (which constitutes only three companies) ended the month with price to tangible book multiples of 131.6% and 103.5%, respectively, with pricing for the $500 million to $1 billion group decreasing 0.3% while the group less than $500 million decreased by 7.2%.
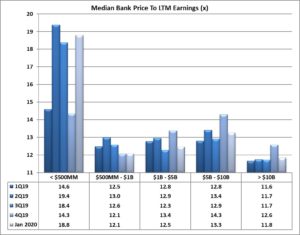
On a price to LTM earnings basis, the largest bank group (over $10 billion) saw a decrease in pricing of 6.1%. The group with assets between $500 million and $1 billion saw the largest decrease in its price to earnings multiple, down 15.9% to 12.1x. The group with assets between $1 billion and $5 billion saw a decrease of 7.3% to a price to earnings multiple of 12.5x (the third lowest among the groups), while the group between $5 billion and $10 billion saw a decrease in pricing by 6.5% to a price earnings multiple of 13.3x. The asset group with less than $500 million assets remained the highest priced with a price to earnings multiple of 18.8x.
Financial institutions under $1 billion reported much lower LTM ROAA (average of medians 0.68%) and loan demand (average Loans/Deposits of 90.2%) than institutions with assets over $1 billion (average of median LTM ROAA of 1.22% and Loans/Deposits of 93.4%).
Mergers & Acquisitions by Region
Bank consolidation was down slightly in January 2020 as compared to January 2019 with 17 transactions announced in January 2020 (11 transactions with terms) compared to 20 transactions (10 with terms) in January 2019. Median YTD pricing in January 2020 was lower than 2019 on a price to tangible book decrease of 8.1% (median 1.48x), a price to 8% tangible book decrease of 4.0% (1.57x), an increase of price to deposits of 18.7% (20.4%), and a price to earnings basis with a 23.0% decrease on LTM earnings (15.4x).
The South region had the highest number of transactions with nine deals in January of which seven reported terms. The North Central region logged four transactions (one with terms) with the lowest price to tangible book multiple of 98% but the highest price to deposits of 46.3%. Transactions in the East reported the highest price to tangible book of the group with a multiple of 177%. There was only one transaction in the Midwest and the Southwest regions with similar price to tangible book multiples of 157% and 156%, respectively. The West region saw zero transactions in the first month of 2020.
Click here to view all the transactions in January 2020