Public Bank Stock Performance- December 2019
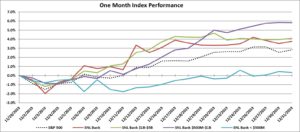
In the month of December, the SNL Bank Index outperformed the S&P 500, with an increase of 3.8% compared to an increase 2.9% for the S&P 500. Stocks saw solid gains at in December thanks to solid economic data and improving trade sentiment.
The month got off to a rough start as trade sentiment turned negative. First, President Trump said that he was considering steel tariffs on Argentina and Brazil. The next day, he expressed that a trade deal with China might not happen until after the 2020 elections. However, the stock market continued to rally following confirmation by officials from both the U.S. and China that the countries had reached a phase-one trade deal. The agreement will include the U.S. reducing the tariff rate on $120 billion worth of Chinese imports to 7.5% from 15% previously, while maintaining an existing 25% tariff on another $250 billion in Chinese imports. The trade truce came as a relief to investors, erasing fears that another round of tariffs would be in the near future.
Recession fears have increased even though the economy has maintained a growth rate around 2% after hovering around 3% a year ago. The Federal Reserve decided to cut the federal funds rate for the third time this year by 25 basis points to a range of 1.50% – 1.75%. Along with the decrease came language pointing to a higher bar for future easing. The Fed reaffirmed its policy stance of maintaining short-term interest rates at their current level in its statement given at the December’s Federal Open Market Committee meeting.
In economic news, data from the U.S. Department of Labor reported that nonfarm payrolls increased by 145,000 in December, compared with forecasts for an increase of 160,000. The unemployment was unchanged at 3.5%, while average hourly earnings increased by 2.9% for the year. Excluding government hiring, private payrolls grew by 202,000 in December, exceeding Dow Jones estimates for 150,000. In November, U.S. existing-home sales increased 2.7% from October. The median existing-home price for all housing types in November was $271,300, up 5.4% from November 2018 ($257,400). November’s price increase marks the 93rd straight month of year-over-year gains.
Bank M&A pricing was down in December 2019 compared to December 2018 on a fewer number of transactions (Click here)
The SNL Bank Index showed an overall increase through the month gaining 3.8%, outperforming the S&P 500, which was up 2.9% during the month. The SNL Bank Index was up in the larger size groups as banks between $1 billion and $5 billion increased 4.1%, banks between $500 million and $1 billion increased 5.8%, and banks below $500 increased 0.3%.
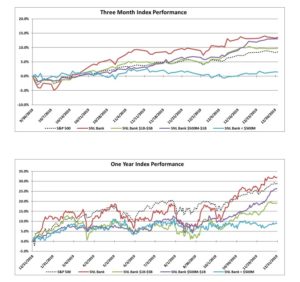
Over the three-month period ending December 2019, the SNL Bank Index increased 13.6% while the S&P 500 gained 8.5%. Over the prior twelve months, the SNL Bank Index increased 32.0% while the S&P 500 increased 28.9%. Banks between $1 billion and $5 billion increased 19.2%, banks between $500 million and $1 billion increased 26.2%, and banks with assets less than $500 million increased 9.0%.
Regional Pricing Highlights
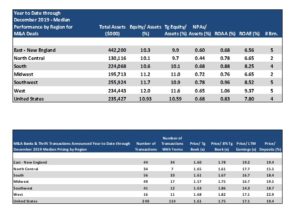
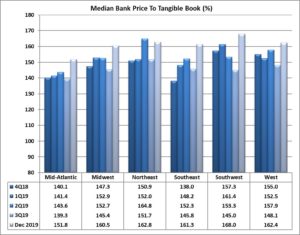
In December, pricing was up across all six regions. The Southwest experienced the largest increase since November of 6.2%, rising to the highest priced region on a price to tangible book multiple of 168.0%. The Northeast became the second highest priced region at 162.8% price to tangible book after gaining 2.8% in the month. The West and Southeast increased 5.2% and 4.7%, respectively, to a price to tangible book of 162.4% and 161.3%, respectively. The Midwest saw the second largest increase, gaining 6.1% to a price to tangible book of 160.5%, while the Mid-Atlantic remained the lowest priced region on a price to tangible book multiple of 151.8%.
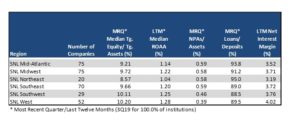
The West remained the most profitable region with an ROAA of 1.28% and had the best NIM of 4.02%, the strongest asset quality (NPAs/Assets 0.39%), and stable loan demand with Loans/Deposits of 89.5%. The Mid-Atlantic was the lowest priced region, and the second lowest in profitability (ROAA of 1.14%) and NIM (3.52%). The Northeast region’s asset quality has remained the same as reported in November (NPAs/Assets of 0.58%) and the region remained the highest in loan demand (Loan/Deposits of 95.0%). The Southwest region remained the second strongest on profitability with an ROAA of 1.25% and the second highest NIM of 3.76%.
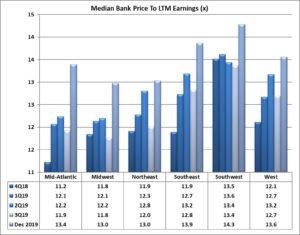
On a median price to earnings basis, pricing increased across five of the six regions. The Southwest region decreased 1.5%, but remains the highest priced region with a price to earnings multiple of 14.3x. The Southeast and West increased 1.8% and 1.7%, respectively, to a price to earnings multiple of 13.9x and 13.6, representing the second and third highest priced regions, respectively. The Mid-Atlantic saw the largest increase of 4.8% in December to a price to earnings multiple of 13.4x. The Midwest and Northeast increased by 4.6% and 1.9%, respectively, in December to a price to earnings multiple of 13.0x (tied for the lowest of the regions).
Pricing by Size
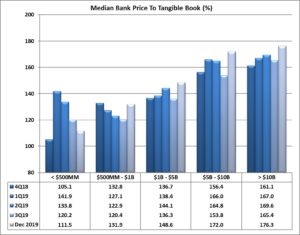
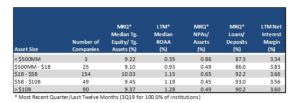
Size continues to impact bank stock prices. Financial institutions with total assets greater than $1 billion consistently report substantially higher median price to tangible book pricing than their peers with total assets less than $1 billion. In the month of December, that differential was 41.3% higher for the peers with assets greater than $1 billion on a price to tangible book basis. The second highest priced asset class remained the group with assets between $5 billion and $10 billion, which experienced an increase in pricing of 6.6% to a 172.0% price to tangible book multiple, below the 176.3% multiple of the banks greater than $10 billion which increased by 1.7%. The group with assets from $1 billion to $5 billion increased by 3.4% to a price to tangible book multiple of 148.6%. The group with assets from $500 million to $1 billion and the group with less than $500 million (which constitutes only three companies) ended the month with price to tangible book multiples of 131.9% and 111.5%, respectively, with pricing for the $500 million to $1 billion group increasing 1.0% while the group less than $500 million decreased by 0.4%. On a price to LTM earnings basis, the largest bank group (over $10 billion) saw an increase in pricing of 2.4%. The group with assets between $500 million and $1 billion saw the largest increase in its price to earnings multiple, up 4.7% to 14.3x. The group with assets between $1 billion and $5 billion saw an increase of 4.3% to a price to earnings multiple of 13.4x (the second lowest among the groups), while the group between $5 billion and $10 billion saw an increase in pricing by 3.5% to a price earnings multiple of 14.2x. The asset group with less than $500 million assets remained the highest priced with a price to earnings multiple of 19.1x.
Financial institutions under $1 billion reported much lower LTM ROAA (average of medians 0.64%) and loan demand (average Loans/Deposits of 86.6%) than institutions with assets over $1 billion (average of median LTM ROAA of 1.19% and Loans/Deposits of 92.3%).

Mergers & Acquisitions by Region
Bank consolidation was up slightly through December 2019 as compared to December 2018 with 240 transactions announced through December 2019 (114 transactions with terms) compared to 234 transactions (124 with terms) through December 2018. Median YTD pricing through 2019 was lower than 2018 on a price to tangible book decrease of 7.9% (median 1.61x), a price to 8% tangible book decrease of 6.7% (1.75x), a decrease of price to deposits of 6.1% (19.4%), and a price to earnings basis with a 30.2% decrease on LTM earnings (17.1x).
The South region passed the Midwest in terms of the highest number of transactions with 56 deals through December of which 33 reported terms. The Midwest region logged 49 transactions (17 with terms) with a price to earnings of 16.7x and a price to deposits of 9.5%. Transactions in the Midwest reported the lowest price to tangible book of the group with a multiple of 157%. Transactions in the East reported the second lowest price to tangible book of the group with a multiple of 160%, the third highest price to 8% tangible book (178%), highest price to earnings multiple (19.2x), and the third highest price to deposits at 19.4%. The West region has reported 16 deals in 2019 with 11 of them reporting terms, and reported the highest pricing on a price to tangible book basis, second highest price to 8% tangible book, and highest price to deposits (168%, 182%, and 22.9%, respectively). The Southwest and North Central had 41 and 34 transactions, respectively, in 2019 (12 and 7 with terms, respectively), with a 163% and 165% price to tangible book, respectively.
Click here to view all the transactions announced in December 2019