
Summary
-
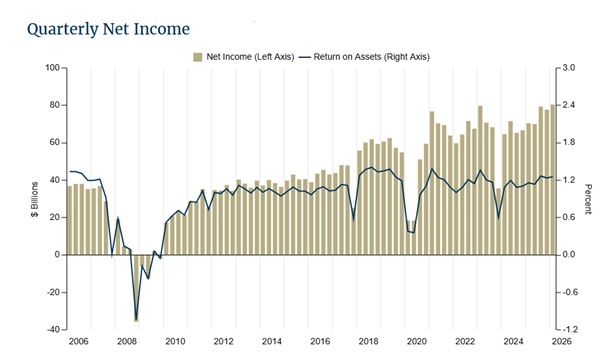
- Quarterly Net Income rose from the prior quarter and the year-ago quarter
- Net Interest Margin (“NIM”) decreased from the prior quarter to 3.31%
- Loan Growth continued, rising 7.1% from the year-ago quarter
- Domestic deposits increased for the seventh consecutive quarter
- Asset Quality Metrics remained generally favorable
- The Deposit Insurance Fund Reserve Ratio increased to 1.43%
Quarterly Net Income Rose from the Prior Quarter and the Year-Ago Quarter
Quarterly net income totaled $80.5 billion in the first quarter of 2026, up $2.8 billion (3.6%) from the prior quarter. The rise in quarterly earnings was driven by robust growth in non-interest income (up $5.0 billion, or 5.8%) at larger institutions but was partially offset by higher non-interest expenses (up $2.5 billion, or 1.6%) and lower net interest income (down $1.6 billion or 0.8%). The return on assets (“ROA”) ratio was 1.26% in the first quarter of 2026, up from 1.23% in the fourth quarter pf 2025 and up from 1.16% in the year-ago quarter. More than half of all banks (55.2%) reported higher net income from the prior quarter. Quarterly net income increased $10.1 billion (14.3%) from the year-ago quarter. The annual increase in net income was driven by higher net interest income (up $13.0 billion, or 7.3%) and higher non-interest income (up $7.1 billion, or 8.5%) but was partially offset by higher non-interest expense (up $10.6 billion, or 7.1%).
Income Statement Drivers
The banking industry reported a NIM of 3.31% in the first quarter of 2026, down 8 basis points from the prior quarter. The quarterly decline in NIM was due to the yield on earning assets falling (down 21 basis points) at a faster rate relative to the cost of funds (down 13 basis points).

Net operating revenue (net interest income plus non-interest income) increased $3.4 billion (1.2%) from the prior quarter to $282.7 billion. The quarterly increase was led by non-interest income (up $5.0 billion, or 5.8%) as net gains on loan sales rebounded from last quarter’s loss and trading revenue expanded. Net interest income declined $1.6 billion (0.8%) as interest income (down $7.3 billion, or 2.3%) had a larger dollar decline relative to interest expense (down $5.7 billion or 4.7%).
Non-interest expense increased $2.5 billion (1.6%) from the prior quarter and $10.6 billion (7.1%) from the year-ago quarter to $159.8 billion. The quarterly increase was driven by higher salaries and employee benefits (up $4.5 billion, or 6.0%) but was partially offset by “all other” non-interest expense, which declined $1.8 billion (2.6%). The annual increase was driven by higher salaries and employee benefits (up $5.0 billion, or 6.8%) and “all other” non-interest expense (up $4.8 billion, or 7.8%).
Quarterly provision expense totaled $21.4 billion in the first quarter, up $475.2 million (2.3%) from the previous quarter but down $1.0 billion (4.6%) from the year-ago quarter. Provision expense exceeded total net charge-offs during the quarter. The reserve coverage ratio (the ratio of the allowance for credit losses to non-current loans) declined from the prior quarter to 166.8%, as the increase in non-current loan balances (up $4.4 billion, or 3.3%) outpaced the increase in the allowance for credit losses (up $1.6 billion, or 0.7%).
Asset Quality
Past-due and nonaccrual (“PDNA”) loans, or loans that are 30 or more days past due or in non-accrual status, decreased 3 basis points from the previous quarter to 1.53%. PDNA rates for credit card loans (down 7 basis points to 3.08%) and auto loans (down 42 basis points to 2.64%) declined on a seasonal basis from the previous quarter. PDNA rates increased for 1–4 family residential loans (up 5 basis points to 2.08%) and non-farm non-residential commercial real estate (“CRE”) loans (up 3 basis points to 1.65%). PDNA rates for multifamily CRE, non-owneroccupied CRE, credit card portfolios, and auto loans remained elevated.
The industry’s net charge-off rate decreased 4 basis points to 0.59% from the prior quarter and was 8 basis points lower than the year-ago quarter. Most of the quarterly decline was led by non-farm non-residential net charge-offs.

Growth
The banking industry reported total assets of $26.1 trillion in the first quarter, an increase of $888.0 billion (3.5%) from the prior quarter and $1.6 trillion (6.6%) from the year-ago quarter. The quarterly increase was led by higher assets in trading accounts (up $253.0 billion, or 22.8%), total loans and leases (up $215.0 billion, or 1.6%), and cash and balances due from depository institutions (up $113.6 billion, or 4.4%). On an annual basis, growth in total loans and leases (up $905.5 billion, or 7.1%), assets in trading accounts (up $255.1 billion, or 23.0%), and securities (up $201.6 billion, or 3.6%) drove the increase.
Total loan and lease balances increased $215.0 billion (1.6%) from the prior quarter to $13.7 trillion. The largest dollar increases among reported categories were commercial and industrial loans (up $96.2 billion, or 4.0%), loans to non-depository financial institutions (up $62.3 billion, or 4.4%), loans to purchase or carry securities, including margin loans (up $39.8 billion, or 7.9%), and nonfarm nonresidential CRE loans (up $18.5 billion, or 1.0%). A seasonal decline in credit card loans partially offset the quarterly increase in total loans and leases. The industry’s loan growth rate in the first quarter was 7.1%, the fastest annual growth rate since the second quarter of 2023.
Domestic deposits increased $389.7 billion (1.2%), the seventh consecutive quarterly increase. Estimated uninsured domestic deposits, which rose $233.5 billion (2.9%) from the prior quarter, drove the increase in domestic deposits. Interest-bearing deposits and non-interest-bearing deposits both increased from the prior quarter.
Capital ratios declined due to asset growth coupled with low capital accretion. The tier 1 risk-based capital ratio declined 18 basis points from the fourth quarter of 2025 to 13.91%. The leverage capital ratio decreased 11 basis points from the fourth quarter of 2025 to 9.15%.
Unrealized losses on securities totaled $325.1 billion, up $19.0 billion (6.2%) from the prior quarter but down $88.1 billion (21.3%) from the year-ago quarter. Unrealized losses on available-for-sale securities were $110.6 billion, up $11.9 billion (12.0%) from the prior quarter but down $40.9 billion (27.0%) from the year-ago quarter. Unrealized losses on held-to-maturity securities were $214.5 billion, up $7.2 billion (3.4%) from the prior quarter but down $47.2 billion (18.0%) from the year-ago quarter. The 30-year mortgage rate remained relatively flat during the first two months of the quarter but rose in March, decreasing the value of mortgage-backed securities reported by banks and increasing unrealized losses.
The number of banks on the FDIC’s “Problem Bank List” decreased by a net of six in the first quarter to 54 banks. The number of problem banks represented 1.3% of total banks in the first quarter, which is in the normal range of 1 to 2 percent for non-crisis periods. The DIF balance increased $3.6 billion to $157.4 billion in the first quarter. The reserve ratio increased 1 basis point during the quarter to 1.43%. The number of FDIC-insured institutions declined by 60 during the first quarter to 4,278. Three banks opened during the quarter; six banks were sold to non-FDIC-insured institutions; 54 institutions merged with other banks; and one bank failed during the first quarter.
