

Summary
- Net Income Increased from the Prior Quarter, Led by Lower Provision Expense and Higher Net Interest Income
- Community Bank Net Income Increased from the Prior Quarter
- Net Interest Margin Increased from the Prior Quarter
- Asset Quality Metrics Remained Generally Favorable, Though Weakness in Certain Portfolios Persisted
- Loan Growth Continued from the Prior Quarter
- Domestic Deposits Increased for the Fifth Consecutive Quarter
- The Deposit Insurance Fund Reserve Ratio Increased 4 Basis Points to 1.40%
Net Income Decreased from the Prior Quarter, Led by Higher Provision Expenses
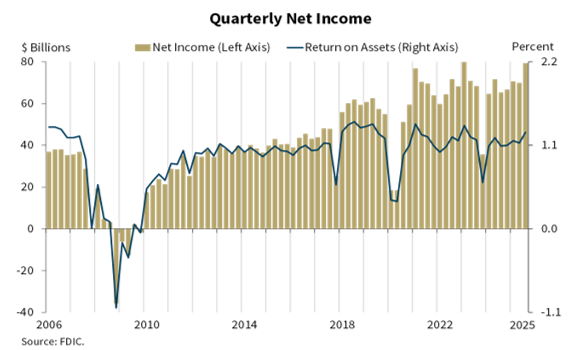
For the 4,379 FDIC-insured commercial banks and savings institutions, quarterly net income totaled $79.3 billion in the third quarter, up $9.4 billion (13.5%) from the prior quarter. The banking industry reported an aggregate return on assets of 1.27% in the third quarter of 2025, up from 1.13% in the second quarter of 2025 and 1.09% in the year-ago quarter. The quarterly increase in net income was driven by lower provision expense (down $9.2 billion, or 30.7%) and higher net interest income (up $7.6 billion, or 4.2%), which were offset by higher income taxes (up $5.0 billion, or 30.1%) and higher non-interest expense (up $2.9 billion, or 1.9%). The quarterly decrease in provision expense was largely attributable to the acquisition of one large bank in the prior quarter. Absent this large provision expense, net income still would have increased, as the industry experienced a $7.6 billion increase in net interest income and a $1.1 billion increase in non-interest income.
Income Statement Drivers
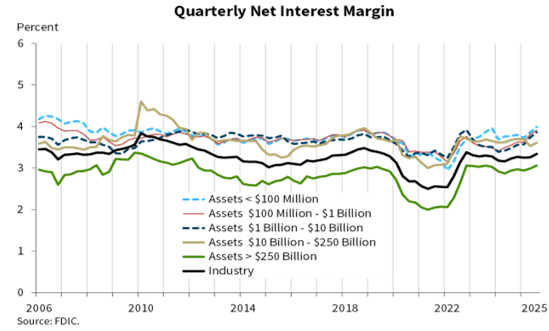
The yield on earning assets rose 11 basis points during the quarter, while the cost of funds increased 2 basis points, resulting in a 9 basis point increase in the industry’s net interest margin (“NIM”). At 3.34%, the industry NIM is above the pre-pandemic average of 3.25%.
The chart below shows the average NIM for the industry and for five asset-sized stratifications. As can be seen, the NIM increased across all asset-size stratifications.
Net operating revenue (net interest income plus non-interest income) increased $8.7 billion (3.3%) quarter over quarter to $275.1 billion on higher net interest income and higher non-interest income. Quarter over quarter, increases in total interest income (up $10.8 billion, or 3.5%), driven by increases in credit card loan income, outpaced increases in interest expense. Non-interest income rose $1.1 billion (1.3%) from the previous quarter, predominantly due to higher trading revenue. Net operating revenue increased $21.6 billion (8.5%) year over year as net interest income increased $13.2 billion and non-interest income increased $8.5 billion. Higher trading revenue drove the annual increase in non-interest income.
Non-interest expense increased $2.9 billion (1.9%) from the prior quarter and $7.5 billion (5.2%) from a year earlier to $152.3 billion. The quarterly increase was led by all other non-interest expense, which rose $1.6 billion (2.6%). The annual increase was attributable to higher salaries and employee benefits (up $3.6 billion, or 5.1%). The efficiency ratio (non-interest expense as a share of net operating revenue) declined from 55.6% in the second quarter of 2025 to 54.7% in the third quarter of 2025.
Quarterly provision expense totaled $20.8 billion in the third quarter, down $9.2 billion (30.7%) from the previous quarter and $2.8 billion (11.7%) from one year earlier. The decrease was largely attributable to the acquisition of one large bank in the prior quarter, as accounting standards require the acquiring institution to recognize a provision expense related to certain acquired assets. Absent this large acquisition, provisions would have slightly declined from the prior quarter and year-ago quarter. The reserve coverage ratio (the ratio of the allowance for credit losses to non-current loans) was 178.4% in the third quarter, a decrease from 179.4% in the previous quarter, as the allowance for credit losses increased at a slower pace than non-current loan balances.
Asset Quality
Past-due and nonaccrual (“PDNA”) loans, or loans that are 30 or more days past due or in non-accrual status, remained the same as the prior quarter at 1.49% of total loans. The industry’s PDNA ratio is still well below the pre-pandemic average of 1.94%. The PDNA rates for non-owner-occupied commercial real estate (“CRE”), multifamily CRE, auto loans, and credit card portfolios remain well above their pre-pandemic averages.
The industry’s net charge-off rate increased 1 basis point to 0.61% from the prior quarter but is 5 basis points lower than the year-ago quarter. The third quarter rate is 13 basis points above the pre-pandemic average, but significantly below the peaks during the Great Financial Crisis. Most portfolios have net charge-off rates above their pre-pandemic averages.
Growth
The banking industry reported total assets of $25.1 trillion in the third quarter, an increase of $124.6 billion (0.5%) from the prior quarter and $901 billion (3.7%) from the year-ago quarter. The quarterly increase was led by higher total loans and leases (up $159.0 billion, or 1.2%), higher assets in trading accounts (up $63.8 billion, or 5.5%), and higher securities (up $59.0 billion, or 1.0%). The increase in total assets was partially offset by a decline in cash and balance due from depository institutions (down $140.2 billion, or 5.3%). On an annual basis, growth in total loans and leases (up $589.8 billion, or 4.7%), assets in trading accounts (up $215.9 billion, or 21.6%), and securities (up $177.4 billion, or 3.2%) drove the increase.
Total loan and lease balances increased $159.0 billion (1.2%) from the prior quarter to $13.2 trillion. The largest portfolio increases were reported in loans to non-depository financial institutions and loans to purchase or carry securities, including margin loans. While growth in these portfolios was in part due to continued reclassifications following changes to how certain loan products should be reported, organic growth and growth in consumer and non-farm non-residential CRE portfolios also contributed to the increase. The industry’s annual rate of loan growth in the third quarter was 4.7%, below the pre-pandemic average of 4.9%.
Domestic deposits increased $92.2 billion (0.5%) from the second quarter of 2025, rising for a fifth consecutive quarter. Interest-bearing deposits increased while non-interest-bearing deposits remained relatively unchanged from the prior quarter. Estimated uninsured domestic deposits drove the increase in domestic deposits, increasing $88.6 billion (1.1%) during the quarter.
Equity capital increased $43.4 billion (1.7%) from the prior quarter to $2.6 trillion. The quarterly increase was led by a decline in unrealized losses on available-for-sale securities of $28.3 billion. The leverage capital ratio decreased 3 basis points from second quarter 2025 to 9.33%.
Unrealized losses on securities decreased $58.2 billion (14.7%) from the prior quarter and $26.9 billion (7.4%) from the year-ago quarter to $337.1 billion. Unrealized losses on available-for sale securities were $115.4 billion, down $28.3 billion (19.7%) from the prior quarter and down $23.3 billion (16.8%) from the year-ago quarter. Unrealized losses on held-to-maturity securities were $221.8 billion, down $29.9 billion (11.9%) from the prior quarter and down $3.6 million (1.6%) from the year-ago quarter.
The number of banks on the FDIC’s “Problem Bank List” decreased by a net of two in the third quarter to 57 banks. The number of problem banks represented 1.3% of total banks in the third quarter, which is in the normal range of 1% to 2% for non-crisis periods. In the third quarter, the Deposit Insurance Fund balance increased $4.8 billion to $150.1 billion. The reserve ratio increased 4 basis points during the quarter to 1.40%. The total number of FDIC-insured institutions declined by 42 during the third quarter to 4,379. Four banks were sold to non-FDIC-insured institutions and 38 institutions merged with other banks.
For more information, contact John Adams, Principal & Head of Investment Banking at (512) 703-1566 or jadams@smslp.com.