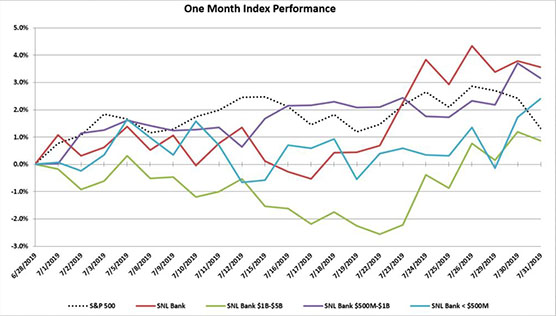
In the month of July the S&P 500 was outperformed by the SNL Bank Index, with an increase of 1.3% compared to 3.6% for the SNL Bank Index. Bank stocks and the broader market were driven higher by better-than-expected Q2 earnings results, while investors welcomed the prospects of easier monetary policy from the Federal Reserve and economic data for the month generally exceeded expectations.
According to Bloomberg Intelligence as of July 31st, year over year earnings growth for S&P 500 companies was 0.8% for the second quarter of 2019, much stronger than the 2.2% decline that was forecast at the beginning of earnings season.
Late in July, the Federal Reserve decided to cut the federal funds rate 25 basis points to a range of 2.0% – 2.25%, which was the first rate cut since December 2008. In his post-meeting press conference, Fed Chairman Jerome Powell indicated future rate cuts are possible, but not guaranteed. This measure combined with the early end of the Fed’s balance sheet reduction plan indicates the Fed is becoming more supportive of the economy.
In other related news, Congress and the White House reached a compromise to pass a budget increasing government spending and suspending the debt ceiling for two years. The passage of the bill was viewed positively by the markets as it eliminated a potential source of politically motivated uncertainty for the time being, and prevented another government shutdown leading up to the 2020 election. Overseas, the risk of the UK leaving the EU without a trade deal increased as Theresa May stepped down as leader of the British government and was replaced by Boris John, a vocal proponent for Brexit. Prime Minister Johnson has stated that he will lead the British exit by the October 31st deadline whether there is a trade deal in place or not.
In economic news, data from the U.S. Department of Labor reported that nonfarm payrolls increased by 164,000 in July, in line with expectations following a downwardly revised 193,000 in June. The unemployment remain unchanged 3.7% but remained near 50-year lows, while the average hourly earnings for employees increased $0.08 in July to $27.98, or a 3.2% increase year over year. In June, U.S. existing-home sales dropped 1.7% from May. Sales were 2.2% below the levels from a year ago, according to the National Association of Realtors. The median existing-home price for all housing types increased to an all-time high of $285,700, up 4.3% from the prior year.
Bank M&A pricing was slightly down in July 2019 compared to July 2018 on a fewer number of transactions (see chart below). The SNL Bank Index showed an overall increase through the month gaining 3.6%, while the S&P 500 increased by 1.3% during the month. The SNL Bank Index was up in all size groups as banks between $1 billion and $5 billion increased 0.9%, banks between $500 million and $1 billion increased 3.2%, and banks below $500 million gained 2.4%.
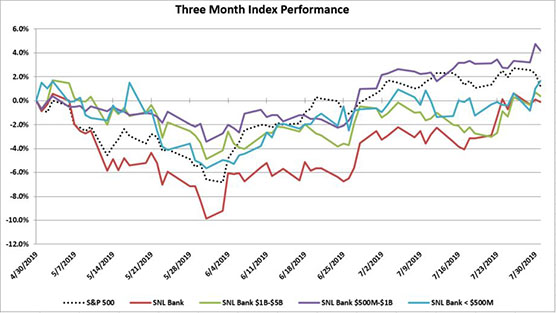
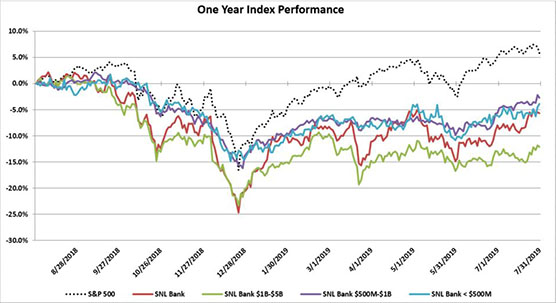
Over the three month period ending July 2019, the SNL Bank Index decreased 0.1% while the S&P 500 gained 1.2%. Over the prior twelve months, the SNL Bank Index decreased 5.7% while the S&P 500 increased 5.8%. Banks between $500 million and $1 billion decreased 2.7%, while banks with assets less than $500 million decreased 3.9%, and banks between $1 billion and $5 billion decreased 12.1%.
REGIONAL PRICING HIGHLIGHTS
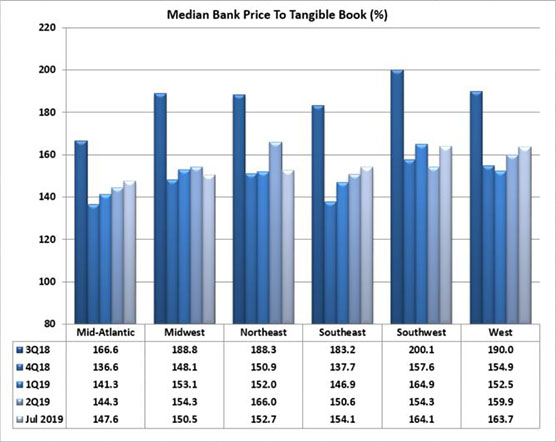
In July, pricing was mixed across the regions. The Southeast experienced the largest increase since June of 2.5%, improving to the third highest priced region on a price to tangible book multiple of 154.1%. The Southwest was the only other region to increase in pricing gaining 2.0% to become the highest priced region at a 164.1% price to tangible book. The Northeast saw the largest decline, dropping 8.3% to a price to tangible book of 152.7%, falling to the fourth highest priced region, while the Mid-Atlantic remained the lowest priced region on a price to tangible book multiple of 147.6%. The Midwest and West decreased 4.9% and 0.1%, respectively, to a price to tangible book of 150.5% and 163.7%, respectively. The West remained the second highest priced region.
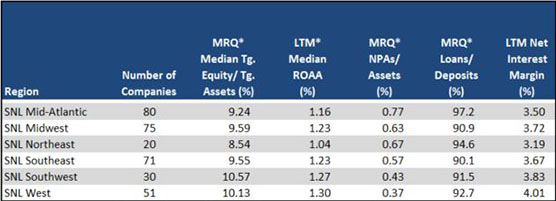
Pricing for public banks in the Southwest was supported by strong earnings (ROAA of 1.27%), net interest margin (3.83%), and asset quality (NPAs/Assets of 0.43%). The Mid-Atlantic was the lowest priced region, and had the weakest asset quality (NPAs/Assets of 0.77%), and second weakest profitability (ROAA of 1.16%) and NIM (3.50%). The Northeast region’s asset quality moved up one spot to the second weakest (NPAs/Assets of 0.67%) and the region remained the second highest in loan demand (Loan/Deposits of 94.6%). The Midwest region remained at the third strongest profitability with an ROAA of 1.23% and a third highest Net Interest Margin of 3.72%. The West remained the most profitable region with an ROAA of 1.30% and had the best Net Interest Margin of 4.01%, the strongest asset quality (NPAs/Assets 0.37%), and improving loan demand with Loans/Deposits of 92.7%.
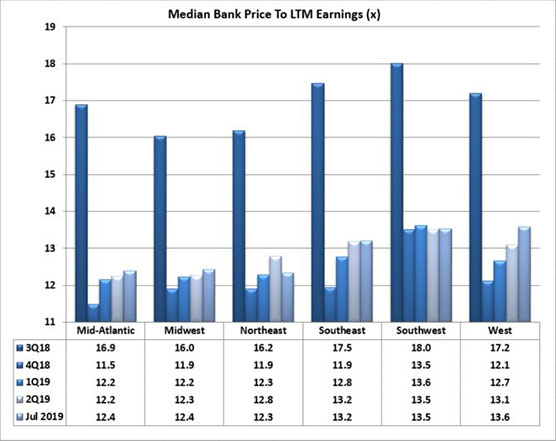
On a median price to earnings basis, pricing decreased across all but one of the regions. The West region increased 1.7%, and is now the highest priced region with a price to earnings multiple of 13.6x. The Southwest region became the second highest priced region with a price to earnings multiple of 13.5x after a decrease of only 0.9% in July. The Southeast region saw a price decrease of 0.6% in July to a price to earnings multiple of 13.2x, maintaining its position as the third highest priced of the regions. The Mid-Atlantic decreased by 3.4% in July to a price to earnings multiple of 12.4x (second lowest in the group). The Northeast decreased the most at 5.4% to a 12.3x price to earnings multiple (the lowest of any group), while the Midwest experienced a decrease of 1.9% to a 12.4x price to earnings multiple, remaining the second lowest of the regions.
PRICING BY SIZE
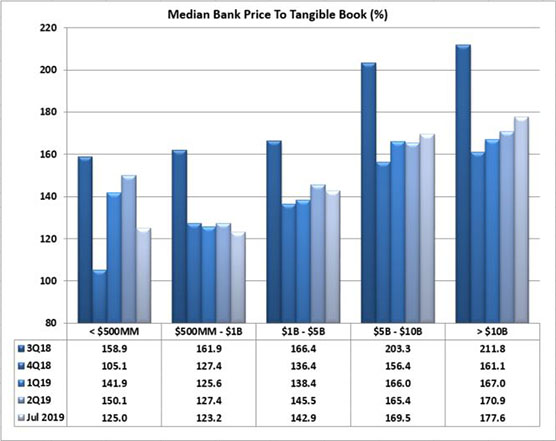
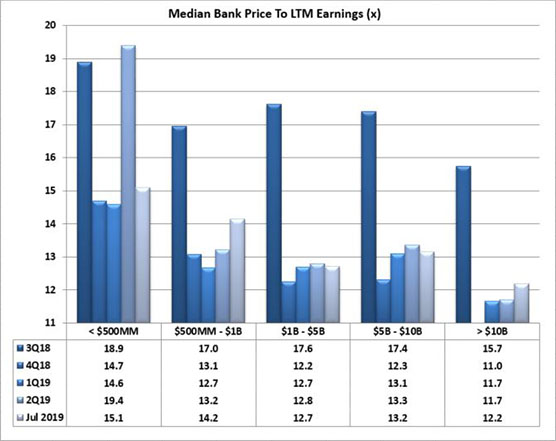
Size continues to impact bank stock prices. Financial institutions with total assets greater than $1 billion consistently report pricing approximately 50% higher median price to tangible book pricing than their peers with total assets less than $1 billion. In the month of May, that differential was 31.6% higher for the peers with assets greater than $1 billion on a price to tangible book basis. The highest priced asset class remained the group with assets between $5 billion and $10 billion, which experienced a decrease in pricing of 1.1% to a 169.5% price to tangible book multiple, below the 177.6% multiple of the banks greater than $10 billion which gained 4.2%. The group with assets from $1 billion to $5 billion saw a decrease in pricing of 2.5% to a price to tangible book multiple of 142.9%. The group with assets from $500 million to $1 billion and the group with less than $500 million (which constitutes only five companies) ended the month with price to tangible book multiples of 123.2% and 125.0%, respectively, with pricing for the $500 million to $1 billion group decreasing 4.2% while the group less than $500 million increased 15.9% (the second consecutive month in which this group increased over 15%). On a price to LTM earnings basis, the largest bank group (over $10 billion) saw an increase in pricing of 0.9%. The group with assets between $500 million and $1 billion saw the largest increase in its price to earnings multiple, up 7.2% to 14.2x and is the second highest priced group. The group with assets between $1 billion and $5 billion saw a decrease of 3.4% to a price to earnings multiple of 12.7x (the lowest among the groups), while the group between $5 billion and $10 billion saw the largest decline in pricing, dropping 6.0% to a price earnings multiple of 13.2x. The highest priced was the group with less than $500 million, increasing 1.5% to a 15.1x price to earnings multiple.
Financial institutions under $1 billion reported much lower LTM ROAA (average of medians 0.93%) and loan demand (average Loans/Deposits of 90.3%) than institutions with assets over $1 billion (average of median LTM ROAA of 1.21% and Loans/Deposits of 93.5%).

Mergers & Acquisitions by Region
Bank consolidation was down through July 2019 as compared to July 2018 with 131 transactions announced through July 2019 (68 transactions with terms) compared to 160 transactions (88 with terms) through July 2018. Median YTD pricing through 2019 was lower than 2018 on a price to tangible book decrease of 7.5% (median 1.61x), a price to 8% tangible book decrease of 8.4% (1.75x), a decrease of price to deposits of 14.8% (18.9%), and a price to earnings basis with a 32.2% decrease on LTM earnings (17.1x).
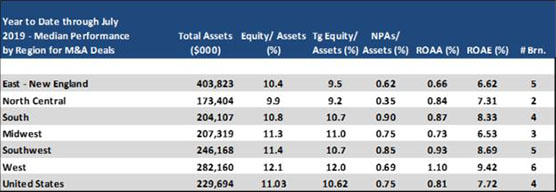
The South region continues to have the highest number of transactions and number of transactions with terms with 29 deals through July of which 18 reported terms. Transactions in the South reported the second lowest price to tangible book of the group with a multiple of 160%, the lowest price to 8% tangible book (123%), third lowest price to earnings (17.1x), and the third lowest price to deposits at 18.3%. The West region has reported 11 deals in 2019 with 7 of them reporting terms, and reported the second highest pricing on a price to tangible book basis, highest price to 8% tangible book, and highest price to deposits (168%, 195%, and 26.7%, respectively). The Midwest and North Central had 28 and 19 transactions, respectively, in 2019 (14 and 6 with terms, respectively), with a 153% and 169% price to tangible book, respectively. The East – New England region logged 22 transactions (16 with terms) with a price to tangible book of 162% and price to deposits of 17.8%. The Southwest had 22 deals through July, and 7 with deal terms.

