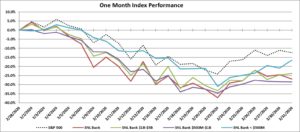
In the month of March, the S&P 500 outperformed the SNL Bank Index, with a decrease of 12.5% compared to a decrease of 27.0% for the SNL Bank Index. The stock market crashed on March 9, 2020, due to concerns over the impact of the COVID-19 coronavirus pandemic.
The stock market crash of 2020 began on Monday, March 9, with history’s largest point plunge for the Dow Jones Industrial Average (DJIA) up to that date. It was followed by two more record-setting point drops on March 12th and March 16th. The stock market crash included the three worst point drops in U.S. history. Sharp gains in the last week of March came from the prospect of massive fiscal and monetary stimulus as President Trump signed a $2 trillion stimulus package into law to curb the economic blow from the coronavirus outbreak, helped markets gain traction. The Federal Reserve’s open-ended asset-purchase program also boosted the stocks.
A recession has become almost inevitable as the pandemic worsened and the Federal Reserve continues to drop rates. The Federal Reserve on March 2, 2020, cut the rate half of a percentage point to a target range of 1.0% to 1.25%, the first rate cut in 2020 following three rate cuts in 2019. Then, on March 15th, in a surprise move, the Federal Reserve cut its benchmark interest rate a full percentage point, to zero. It also launched a bond-buying program, referred to as quantitative easing, to mitigate the expected damage to the U.S. economy from the coronavirus.
In economic news, data from the U.S. Department of Labor reported that nonfarm payrolls dropped 701,000 in March, capturing the beginning of the job market collapse. The unemployment rate increased to 4.4%, while average hourly earnings increased by 3.1% year over year. Excluding government hiring, private payrolls decreased by 713,000 in March. In February, U.S. existing-home sales increased 6.5% from January. The median existing-home price for all housing types in February was $270,100, up 8.0% from February 2019 ($250,100). February’s price increase marks the 96th straight month of year-over-year gains.
Bank M&A pricing was down in March 2020 compared to March 2019 on a fewer number of transactions:
Click here for March 2020 M&A deals
The SNL Bank Index showed an overall decrease through the month dropping 27.0%, compared to the S&P 500, which was down 12.5%. The SNL Bank Index was down in the larger size groups as banks between $1 billion and $5 billion decreased 23.9%, banks between $500 million and $1 billion decreased 16.5%.
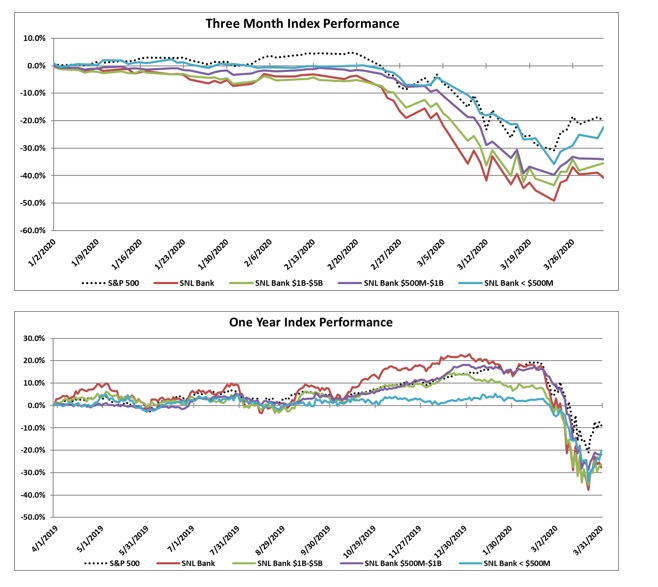
Over the three-month period ending March 2020, the SNL Bank Index decreased 40.8% while the S&P 500 decreased 20.0%. Over the prior twelve months, the SNL Bank Index decreased 27.7% while the S&P 500 increased 8.8%. Banks between $1 billion and $5 billion decreased 26.4%, banks between $500 million and $1 billion decreased 22.0%, and banks with assets less than $500 million decreased 20.1%.
Regional Pricing Highlights
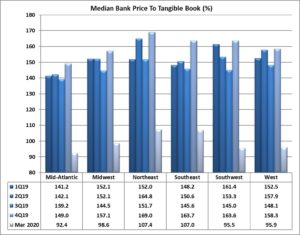
In March, pricing was down across all six regions. The Southwest experienced the largest decrease since February of 31.3%, falling from the highest priced region to the second lowest priced region with a price to tangible book multiple of 95.5%. The Northeast became the highest priced region at 107.4% price to tangible book after decreasing by 19.5% in the month. The Midwest and West decreased 23.9% and 26.7%, respectively, to a price to tangible book of 98.6% and 95.9%, respectively. The Southeast saw the smallest decrease of 19.0% to a price to tangible book of 107.0%, while the Mid-Atlantic was the lowest priced region on a price to tangible book multiple of 92.4%.
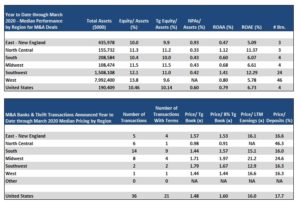
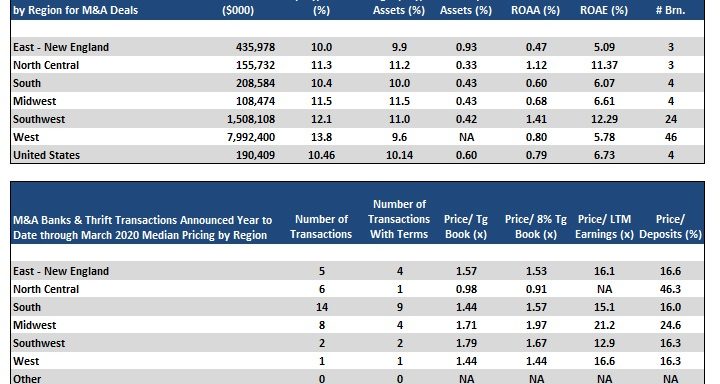
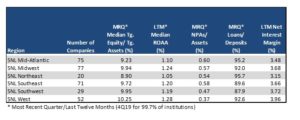
The West remained the most profitable region with an ROAA of 1.28% and had the best NIM of 3.96%, the strongest asset quality (NPAs/Assets 0.37%), and stable loan demand with Loans/Deposits of 92.6%. The Midwest was the third highest priced region, and was the second highest in profitability (ROAA of 1.24%) and had NIM of 3.68%. The Northeast region’s asset quality has decreased slightly, with more banks reporting fourth quarter financials since February (NPAs/Assets of 0.54% from 0.50%) and the region remained the highest in loan demand (Loan/Deposits of 95.7%). The Southwest region had the second strongest NIM of 3.72% and the fourth strongest profitability with an ROAA of 1.19%.
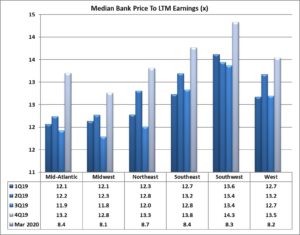
On a median price to earnings basis, pricing decreased across all of the six regions. The Southwest region decreased the most by 30.7%, and dropped from the highest priced region to the third lowest priced region with a price to earnings multiple of 8.3x. The Southeast and Mid-Atlantic decreased 27.6% and 25.1%, respectively, to a price to earnings multiple of 8.4x, tied for the second highest priced multiple. The Northeast saw the smallest decrease of 22.9% in March to a price to earnings multiple of 8.7x, representing the highest priced region based on the price to earnings multiple. The Midwest and West decreased by 25.6% and 28.6%, respectively, in March to a price to earnings multiple of 8.1x and 8.2x, respectively (representing the lowest and second lowest priced region).
Pricing By Size
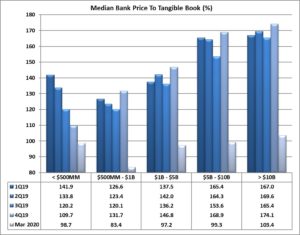
Size continues to impact bank stock prices. Financial institutions with total assets greater than $1 billion consistently report substantially higher median price to tangible book pricing than their peers with total assets less than $1 billion. In the month of March, that differential was 9.0% higher for the peers with assets greater than $1 billion on a price to tangible book basis. The second highest priced asset class remained the group with assets between $5 billion and $10 billion, which experienced a decrease in pricing of 28.2% to a 99.3% price to tangible book multiple, below the 103.4% multiple of the banks greater than $10 billion which decreased by 26.3%. The group with assets from $1 billion to $5 billion decreased by 22.9% to a price to tangible book multiple of 97.2%. The group with assets from $500 million to $1 billion and the group with less than $500 million (which constitutes only three companies) ended the month with price to tangible book multiples of 83.4% and 98.7%, respectively, with pricing for the $500 million to $1 billion group decreasing 34.9% while the group less than $500 million decreased by 1.7%.
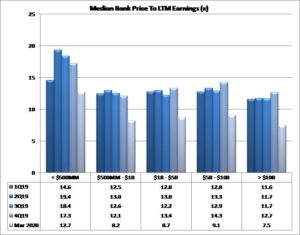
On a price to LTM earnings basis, the largest bank group (over $10 billion) saw a decrease in pricing of 27.7%. The group with assets between $500 million and $1 billion saw the largest decrease in its price to earnings multiple, down 31.6% to 8.2x. The group with assets between $1 billion and $5 billion saw a decrease of 25.1% to a price to earnings multiple of 8.7x (the third lowest among the groups), while the group between $5 billion and $10 billion saw a decrease in pricing by 23.1% to a price earnings multiple of 9.1x. The asset group with less than $500 million assets remained the highest priced with a price to earnings multiple of 12.7x.
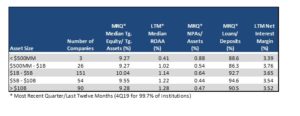
Financial institutions under $1 billion reported much lower LTM ROAA (average of medians 0.72%) and loan demand (average Loans/Deposits of 87.4%) than institutions with assets over $1 billion (average of median LTM ROAA of 1.22% and Loans/Deposits of 92.7%).
Mergers & Acquisitions by Region
Bank consolidation was down slightly in March 2020 as compared to March 2019 with 36 transactions announced YTD through March 2020 (21 transactions with terms) compared to 45 transactions (20 with terms) through March 2019. Median YTD pricing in March 2020 was lower than 2019 on a price to tangible book decrease of 8.1% (median 1.48x), a price to 8% tangible book decrease of 3.2% (1.60x), an increase of price to deposits of 0.9% (17.7%), and a price to earnings basis with a 5.6% increase on LTM earnings (16.0x).
The South region had the highest number of transactions with fourteen deals through March of which nine reported terms. The North Central region logged six transactions (one with terms) with the lowest price to tangible book multiple of 98% but the highest price to deposits of 46.3%. Transactions in the Southwest reported the highest price to tangible book of the group with a multiple of 179%. There were eight transactions in the Midwest and only one transaction in the West with price to tangible book multiples of 171% and 144%, respectively. The East region saw five transactions in the first three months of 2020 with the third highest price to tangible book multiple of 157%.
Click here to view all the transactions announced in March 2020